This Iconic West Coast City Is Now More Popular Than Los Angeles


Share The Article

Take it from a local like me.

“California” and “government” in the same sentence often draws a side-eye. However, when it comes to tourism reports, our ears perk up like a dog hearing the treat bag.

The latest government report doesn’t reflect the sky-high rent I pay or the high-speed train that’s been teased for years; it reflects a shocking revelation.

That is, until you dig a little deeper…

Distant view of San Francisco skyline

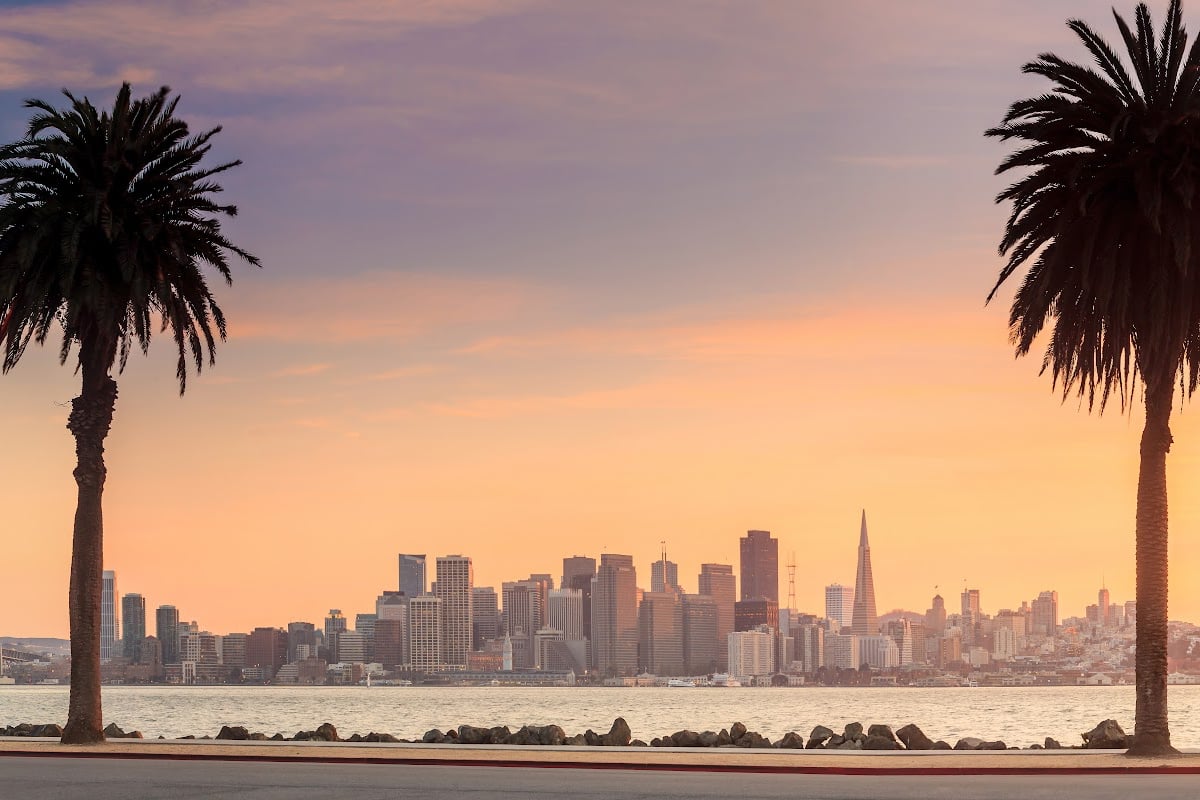
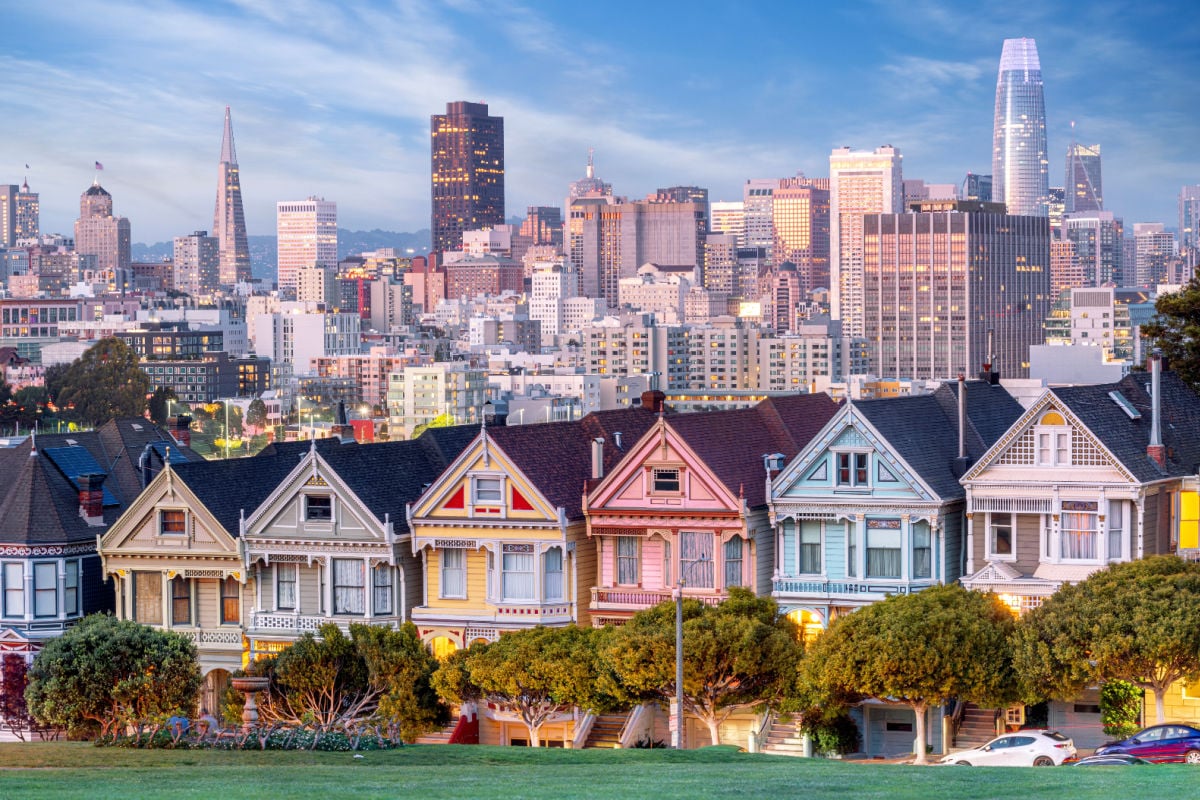
San Francisco is now more popular than Los Angeles, both icons in their own right.

As you may have heard, LA hasn’t exactly done a great job cleaning up its image — or its streets — whether it’s world-famous Hollywood Boulevard or parts of downtown that could be mistaken for a zombie film set.

San Fran is not only more popular now, but seems to be safer, an aspect that has dimmed the former bright lights of Hollywood.

LA Vs. SF: Safety By The Numbers

No, we’re not having a Dodgers-Giants or Rams-49ers face-off. This is a duel that travelers really care about.

San Francisco's Colorful Victorian homes backdropped by skyline

Of course, there are no travel advisories for either of these cities since the State Department doesn’t issue domestic travel advisories and wouldn’t want to blemish the image of 2 cities who have already struggled with public perception anyway.

That said, that’s where our Safety Index comes in handy like Steve’s notebook.

Travelers have clearly spoken, crowning San Fran as the clear winner for cleaning up their act.

Remember, not long ago, during and immediately after the pandemic, SF struggled to keep negative headlines at bay as criminals were running rampant.

San Francisco's Chinatown

Now, the city is in the green — literally. — earning an impressive safety score of 81/100, all things considered.

LA, on the other hand? Yikes…

I last visited in April, and I was sketched out just walking under an overpass to watch the Preds get smoked by the Kings at the Crypto.com Arena.

It’s dirty, there are homeless encampments seemingly filling every nook and cranny, and I’m sure the city means well, but it’s not exactly the most inviting sight to see such a heavy dose of security guards meandering each block as if they expect something to go down.

Fisherman's Wharf in San Francisco

Personally, I don’t feel safe in many pockets of LA and I voted as such on our Safety Index, which currently sits at a less-than-stellar score of 68/100.

But hey, at least it’s not 67. Hopefully, that fad ended…

Right, kids?

San Francisco Wins Popularity Contest

As the state of California remains America’s top tourism destination, it used to be that LA was the top dog no matter what.

But here’s how far things have changed: mayoral races rarely make national headlines unless a city is facing serious problems — though another reality TV star forcing their way into politics certainly helps draw attention.

LA’s image has become so dire after the Pacific Palisades and Altadena fires that nobody seems to talk about the Santa Monica pier, Rodeo Drive, or Hollywood in general, unless its a complaint of how much of a cesspool its become, one that is not only aesthetically off-putting but feels unsafe to explore.

An old orange San Francisco cable car

On the flip side, San Francisco is seeing a hefty influx of tourists and they’re spending beaucoups of money — the most in the state, in fact.

LA may see more passengers arriving at LAX compared to SFO by year’s end, but the real marker of success is visitors are actually staying a while, boosting the economy with epic meals at Chinatown and North Beach, booking a scenic boat tour to Alcatraz, and shopping ’til they drop at Fisherman’s Wharf.

Having visited both San Fran and LA within the last year, there’s no denying the former has flipped the switch with the exception of the long-struggling Tenderloin District.

Female hiker on Angel Island State Park in San Francisco

Overall, the vibe is so much different between these cities.

You can catch me riding the BART any time, but there’s no way I’m stepping foot on LA’s public transit, even if they’ve claimed renewed efforts to implore solutions for cleanliness and safety, along with the recent launch of a new route to the glitz and glamour of Beverly Hills’s new station.

SF & LA Both Play World Cup Hosts

If there’s one thing both cities have going for them it’s sports, as much as I hate to say that as Padres fan.

Sports have become a major driver for tourism for both cities, especially since San Fran held last year’s Super Bowl and has passed the baton to LA (well, Carson technically) for the upcoming NFL season.

Sofi Stadium

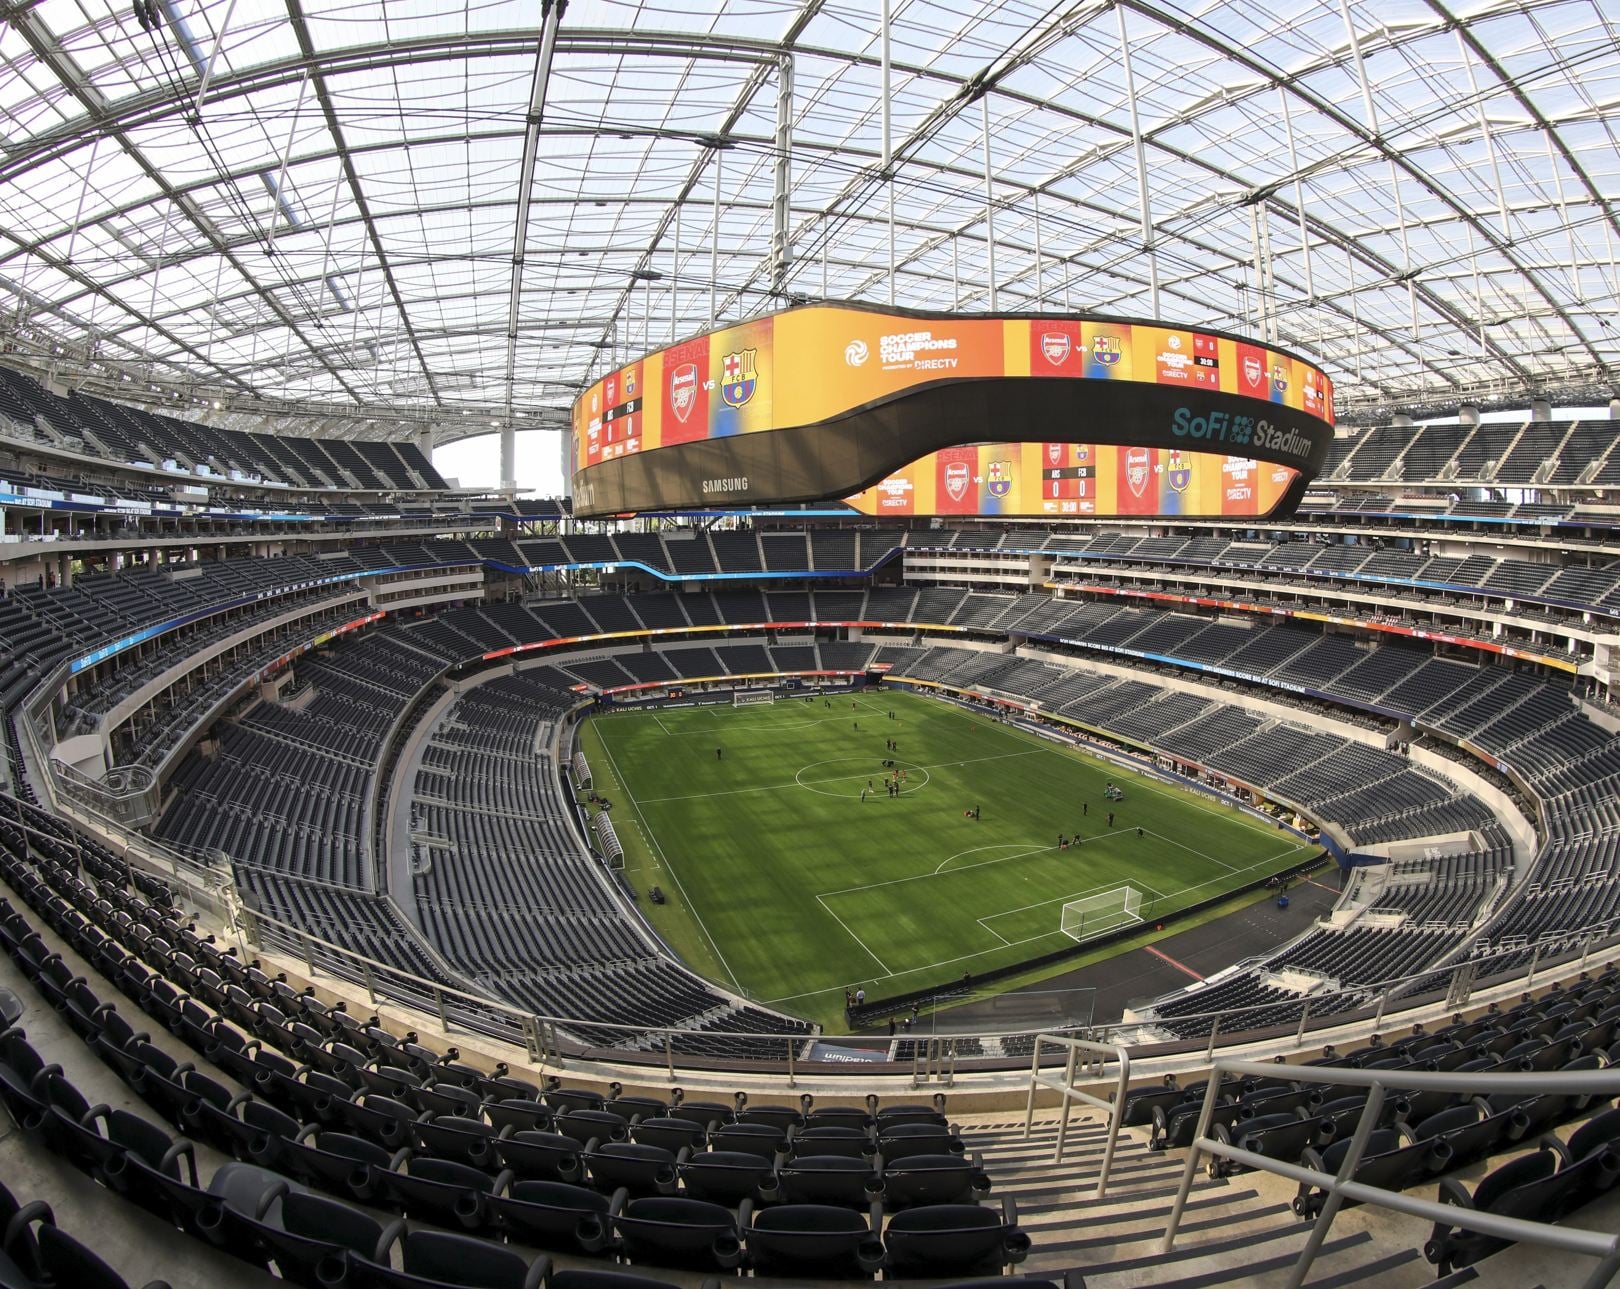
Most notably, both cities are playing host to the World Cup — ya know, real football if you want to sound worldly.

Make sure you factor that in when booking a trip as there are numerous reports revealing sky-high accommodations, not that either city was known to be budget-friendly in the first place.

LA will host 8 World Cup matches at SoFi Stadium, while the San Francisco Bay Area gets 6 at Levi’s Stadium in Santa Clara.

Los Angeles World Cup dates:

  • June 12, 2026
  • June 15, 2026
  • June 18, 2026
  • June 21, 2026
  • June 25, 2026
  • June 28, 2026
  • July 2, 2026
  • July 10, 2026

San Francisco World Cup dates:

  • June 13, 2026
  • June 16, 2026
  • June 19, 2026
  • June 22, 2026
  • June 25, 2026
  • July 1, 2026

Check out our World Cup Safety Index for real-time details before locking in your plans.


Source link

Leave a Reply

Subscribe to Our Newsletter

Get our latest articles delivered straight to your inbox. No spam, we promise.

Recent Reviews


Another day, another politically motivated attack in the United States.

This morning’s shooting at a Dallas ICE detention facility – where a sniper killed two detainees and wounded another before taking his own life prompted me to revisit a question that’s been troubling me: Is political violence actually increasing in America, or does it just feel that way?

To explore this, I’ve conducted what I’ll call a methodological experiment.

Rather than relying on traditional datasets, I’ve used ChatGPT and Claude to construct a synthetic index of political violence in the US since 1945. Let me be absolutely clear: this isn’t conventional data. It’s data generated through language models, with all the limitations that implies.

The Methodology (and Its Limitations)

Here’s what I did: I asked both ChatGPT and Claude to generate lists of politically motivated violent incidents since 1945, then had them score each incident’s severity on a scale where 50 represents a “normal” level.

The models assessed both casualties and symbolic significance, and I used them to cross-check each other’s work. I then quality-checked the output myself and categorised perpetrators by political affiliation where this was clearly established.

This approach is, admittedly, unorthodox. Language models are trained on existing texts and may reflect biases in their training data. They might overweight highly publicised events or recent incidents that featured prominently in their training corpus.

The “data” we’re looking at is essentially a structured synthesis of what these models have absorbed about American political violence.

Yet there’s something intriguing here. These models have processed vast amounts of information about political violence – news reports, academic studies, government documents. Their output might capture patterns that traditional datasets miss, though it might also amplify certain narratives or blind spots.

What the Synthetic Data Reveal

With those caveats firmly in mind, the patterns that emerge from this exercise are concerning. The model-generated index shows a clear upward trend in political violence over the past decade.

Looking at the breakdown by perpetrator ideology (where clearly established), the data suggest that right-wing extremist groups have been responsible for the majority of incidents in recent years, though we cannot draw conclusions about today’s attack whilst investigations are ongoing.

The synthetic data align with some empirical observations. Princeton’s Bridging Divides Initiative recorded over 600 incidents of threats and harassment against local officials in 2024 – a 74% increase from 2022. The University of Maryland found that in the first half of 2025, 35% of violent events targeted U.S. government personnel or facilities – more than twice the rate in 2024.

The Charlie Kirk Assassination and Recent Patterns

The September assassination of conservative activist Charlie Kirk marked a particularly dark moment.

The incident followed numerous recent acts of political violence, including the murder of Minnesota Democratic state Rep. Melissa Hortman and her husband, and two assassination attempts on President Trump in 2024.

What the synthetic data reveal is not just increased frequency but a shift in patterns. While overall levels of physical political violence remained low in 2024 compared to years prior, acts of vigilante violence grew as a proportion of all reported incidents.

We’re seeing less organised group violence and more lone-wolf attacks – a pattern that’s harder to predict and prevent.

The Epistemological Challenge

When we use language models to generate “data” about social phenomena, what exactly are we measuring? We’re essentially extracting structured information from the collective corpus of human writing about these events. It’s aggregating distributed information, but through an AI intermediary rather than traditional data collection methods.

This raises fascinating questions.

The models suggest that right-wing extremist violence has been responsible for a fairly large majority of U.S. domestic terrorism deaths since 2001. But how much of this reflects actual patterns versus the way these events are covered and discussed in the sources the models were trained on?

The synthetic data are, in a sense, a mirror of our collective discourse about political violence. They reflect not just what happened, but how we’ve talked about what happened. That’s both a limitation and, potentially, a feature – understanding the narrative landscape around political violence might be as important as counting incidents.

An Experimental Tool

I’ve built an interactive app (using the AI coding tool Lovable) based on this language model-generated violence index.

Users can explore the synthetic data, examine patterns across different time periods and perpetrator groups, and understand the methodology behind it. Think of it as an experiment in using AI to structure historical information rather than a definitive dataset.

The value isn’t in treating this as gospel truth, but in what it reveals about how these events are recorded, remembered, and synthesised in our collective digital memory.

When language models trained on our civilisation’s text output show rising political violence, it tells us something – even if that something is as much about narrative as about underlying reality.

This morning’s tragedy in Dallas reminds us that behind every data point – whether traditionally collected or AI-generated – there are real victims and real consequences. Understanding the patterns, however imperfectly, is the first step toward addressing them.

Try the tool here.


Source link