This is the smartwatch most iPhone users should buy (and it’s $120 off)


prime-day-placeholder-image

Nina Raemont/ZDNET

Follow ZDNET: Add us as a preferred source on Google.


Save $120: The Apple Watch Series 11 just hit a very low price on Amazon for Prime Day, dropping down to $279 from $400 — that’s 30% off.

There are a few reasons why someone would consider buying a smartwatch like the Apple Watch. Maybe they want a constant stream of information on their wrist, or maybe they want to start leaving their phone at home and using a more minimalist communication device instead of their iPhone. A smartwatch is also a helpful device for those looking to stay active, record their workouts, track their sleep, or keep a health condition in check. 

Also: The best Amazon Prime Day deals: Live updates

These devices are certainly helpful for all sorts of uses, but they can be expensive. During deals events like Amazon Prime Day, these products see substantial discounts that make them a little more affordable. For example, during Prime Day this year, Amazon cuts the price of the Apple Watch Series 11 down to $279, reducing its price by $120. 

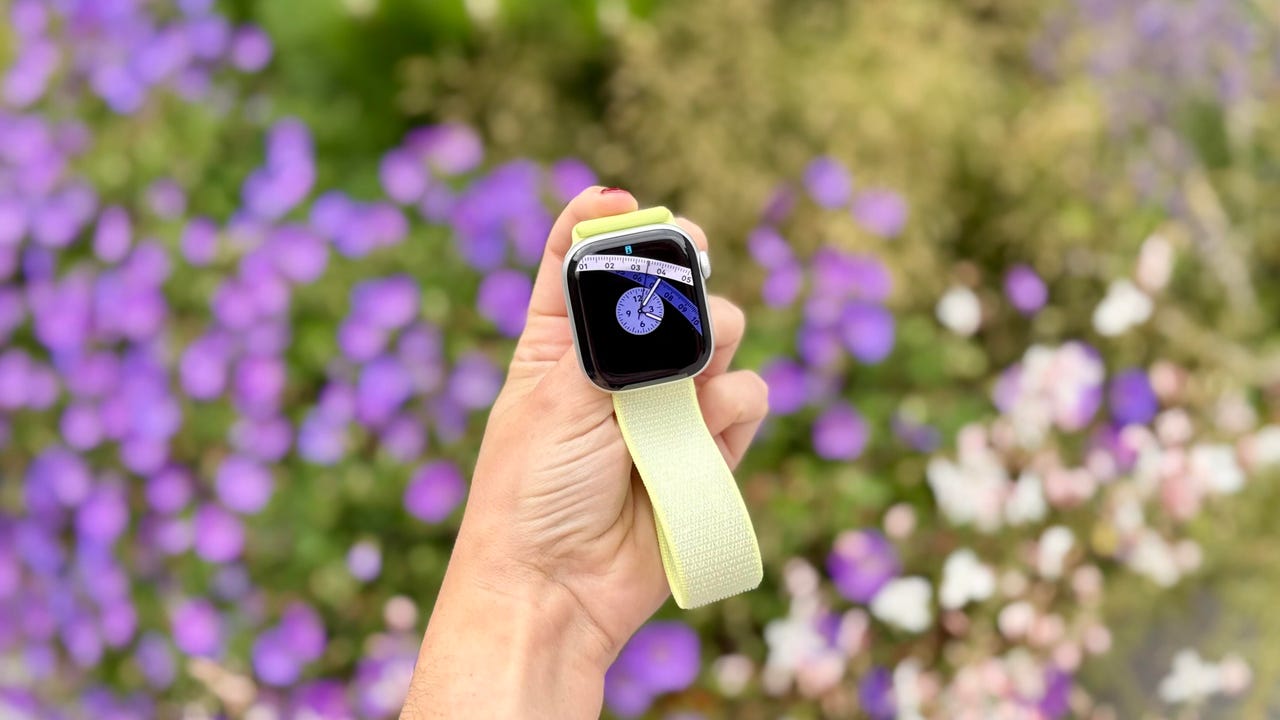
Not only did I see Apple unveil the Apple Watch Series 11 at its September iPhone event, but I have also tested, reviewed, and constantly worn the smartwatch. 

The Apple Watch Series 11 is an upgrade from 2024’s Apple Watch Series 10, because Apple increased the battery life by six hours, giving the newer watch a 24-hour battery, at long last. 

I like wearing my Apple Watch for workouts and daytime activities, primarily. I love closing my Activity Rings each day and using the device to track my strength training workouts, yoga classes, or cardio. It’s an accurate exercise tracker and a wonderful source of encouragement for daily movement. I have slept with it, but it’s still a bulky device compared to a smart ring, so I tend to charge it at night and use it more throughout the day. If you wanted to sleep with it, Apple has updated the smartwatch with Sleep Scores to quantify and keep track of your sleep health. 

Also: I tracked 3,000 steps on my Apple Watch, Google Pixel, and Oura Ring – this one was most accurate

Hypertension Detection came to the smartwatch last year as well, and it’s especially helpful for those concerned with their blood pressure levels. The FDA-cleared feature tracks your blood pressure during your sleep for 30 days to assess whether it’s within or above a normal range. Once the 30-day period is over, Apple will notify you of possible hypertension and provide you with materials to see a medical professional and address the issue. 

The Apple Watch Series 11 sits in between the affordable $250 Apple Watch SE 3 and the $700 Apple Watch Ultra 3. It’s the watch to buy if you want a long battery life, exercise and sleep with your watch, and don’t need some of the more rugged features (like Emergency SOS or maximum durability) that the Ultra 3 has. 

Also: I’ve tested every Apple Watch model – my top pick is on sale

How I rated this deal 

I rated this deal a 5/5 because the Apple Watch Series 11 is 30% off, and this is a reliable smartwatch that I’d recommend to any iPhone owner in the market for a smartwatch. 

Amazon Prime Day runs Tuesday, June 23 to Friday, June 26, 2026. The event is a bit earlier this year, as it usually takes place during the first few weeks of July. 


Show more

Deals are subject to sell out or expire anytime, though ZDNET remains committed to finding, sharing, and updating the best product deals for you to score the best savings. Our team of experts regularly checks in on the deals we share to ensure they are still live and obtainable. We’re sorry if you’ve missed out on this deal, but don’t fret — we’re constantly finding new chances to save and sharing them with you at ZDNET.com


Show more

We aim to deliver the most accurate advice to help you shop smarter. ZDNET offers 33 years of experience, 30 hands-on product reviewers, and 10,000 square feet of lab space to ensure we bring you the best of tech. 

In 2025, we refined our approach to deals, developing a measurable system for sharing savings with readers like you. Our editor’s deal rating badges are affixed to most of our deal content, making it easy to interpret our expertise to help you make the best purchase decision.

At the core of this approach is a percentage-off-based system to classify savings offered on top-tech products, combined with a sliding-scale system based on our team members’ expertise and several factors like frequency, brand or product recognition, and more. The result? Hand-crafted deals chosen specifically for ZDNET readers like you, fully backed by our experts. 

Also: How we rate deals at ZDNET in 2026


Show more


Source link

Leave a Reply

Subscribe to Our Newsletter

Get our latest articles delivered straight to your inbox. No spam, we promise.

Recent Reviews


Another day, another politically motivated attack in the United States.

This morning’s shooting at a Dallas ICE detention facility – where a sniper killed two detainees and wounded another before taking his own life prompted me to revisit a question that’s been troubling me: Is political violence actually increasing in America, or does it just feel that way?

To explore this, I’ve conducted what I’ll call a methodological experiment.

Rather than relying on traditional datasets, I’ve used ChatGPT and Claude to construct a synthetic index of political violence in the US since 1945. Let me be absolutely clear: this isn’t conventional data. It’s data generated through language models, with all the limitations that implies.

The Methodology (and Its Limitations)

Here’s what I did: I asked both ChatGPT and Claude to generate lists of politically motivated violent incidents since 1945, then had them score each incident’s severity on a scale where 50 represents a “normal” level.

The models assessed both casualties and symbolic significance, and I used them to cross-check each other’s work. I then quality-checked the output myself and categorised perpetrators by political affiliation where this was clearly established.

This approach is, admittedly, unorthodox. Language models are trained on existing texts and may reflect biases in their training data. They might overweight highly publicised events or recent incidents that featured prominently in their training corpus.

The “data” we’re looking at is essentially a structured synthesis of what these models have absorbed about American political violence.

Yet there’s something intriguing here. These models have processed vast amounts of information about political violence – news reports, academic studies, government documents. Their output might capture patterns that traditional datasets miss, though it might also amplify certain narratives or blind spots.

What the Synthetic Data Reveal

With those caveats firmly in mind, the patterns that emerge from this exercise are concerning. The model-generated index shows a clear upward trend in political violence over the past decade.

Looking at the breakdown by perpetrator ideology (where clearly established), the data suggest that right-wing extremist groups have been responsible for the majority of incidents in recent years, though we cannot draw conclusions about today’s attack whilst investigations are ongoing.

The synthetic data align with some empirical observations. Princeton’s Bridging Divides Initiative recorded over 600 incidents of threats and harassment against local officials in 2024 – a 74% increase from 2022. The University of Maryland found that in the first half of 2025, 35% of violent events targeted U.S. government personnel or facilities – more than twice the rate in 2024.

The Charlie Kirk Assassination and Recent Patterns

The September assassination of conservative activist Charlie Kirk marked a particularly dark moment.

The incident followed numerous recent acts of political violence, including the murder of Minnesota Democratic state Rep. Melissa Hortman and her husband, and two assassination attempts on President Trump in 2024.

What the synthetic data reveal is not just increased frequency but a shift in patterns. While overall levels of physical political violence remained low in 2024 compared to years prior, acts of vigilante violence grew as a proportion of all reported incidents.

We’re seeing less organised group violence and more lone-wolf attacks – a pattern that’s harder to predict and prevent.

The Epistemological Challenge

When we use language models to generate “data” about social phenomena, what exactly are we measuring? We’re essentially extracting structured information from the collective corpus of human writing about these events. It’s aggregating distributed information, but through an AI intermediary rather than traditional data collection methods.

This raises fascinating questions.

The models suggest that right-wing extremist violence has been responsible for a fairly large majority of U.S. domestic terrorism deaths since 2001. But how much of this reflects actual patterns versus the way these events are covered and discussed in the sources the models were trained on?

The synthetic data are, in a sense, a mirror of our collective discourse about political violence. They reflect not just what happened, but how we’ve talked about what happened. That’s both a limitation and, potentially, a feature – understanding the narrative landscape around political violence might be as important as counting incidents.

An Experimental Tool

I’ve built an interactive app (using the AI coding tool Lovable) based on this language model-generated violence index.

Users can explore the synthetic data, examine patterns across different time periods and perpetrator groups, and understand the methodology behind it. Think of it as an experiment in using AI to structure historical information rather than a definitive dataset.

The value isn’t in treating this as gospel truth, but in what it reveals about how these events are recorded, remembered, and synthesised in our collective digital memory.

When language models trained on our civilisation’s text output show rising political violence, it tells us something – even if that something is as much about narrative as about underlying reality.

This morning’s tragedy in Dallas reminds us that behind every data point – whether traditionally collected or AI-generated – there are real victims and real consequences. Understanding the patterns, however imperfectly, is the first step toward addressing them.

Try the tool here.


Source link