The iPad Air and iPad Pro are Apple’s higher-end, premium, full-sized tablets, devices intended for anyone who finds the base iPad lacking. It’s very much like the difference between the iPhone and iPhone Pro; the iPad Air is a solid contender at an attractive price that will be plenty for most users. But for anyone whose budget can accommodate, the Pro treats you to the best a modern tablet has to offer. So if we get down to brass tacks and cut through Apple’s marketing jargon, what specific, exclusive features does the iPad Pro actually have that the iPad Air does not?
Basing things on the price, you’d be pleasantly (or perhaps unpleasantly) surprised at how little these two products actually diverge from one another. Everything on this list is a concrete item that the iPad Air lacks completely, so we’re intentionally avoiding any differences that amount to “the Air can do this, but the iPad Pro does it better.” Use this as a reference or buying guide for the latest iPad Air and iPad Pro.
The latest M5 chip
At the time of writing, the current iPad Pro released in 2025 packs Apple’s bleeding-edge M5 Apple Silicon chip. Compare that to the current iPad Air released in 2026, which has the M4. The M4 released on the iPad Pro in 2024 was a powerhouse then (and still is now), and even a couple of years later, the iPad Air is getting the M4 at a steal of a price point. So how do they compare?
Specs-wise, the M5 is nuts. The iPad Pro can effortlessly play AAA titles available on the App Store at high resolutions, high graphic settings, and stable frame rates. There are added benefits to the M5 generation specifically, such as improved ray tracing in the games that support it. Those doing AI workloads will also notice an uplift when throwing the GPU at them. 4K videos export in minutes. Importantly, the Pro does all of this without a fan and while staying surprisingly cool.
That sounds nice, but in most cases there’s only a 10% difference between the M5 and the M4 for demanding workloads. For everything else, the difference is likely going to be imperceptible when testing the iPad Air and iPad Pro side by side. Typical iPad activities — streaming content, checking emails, web browsing — won’t improve meaningfully with the M5. It’s the same issue the iPad Pro has had for years: too much power, wasted because it’s imprisoned behind iPadOS’s restrictive operating system. It goes without saying that if you don’t have a professional workflow, you don’t need the iPad Pro M5 — and even if you do, the Air is probably still overkill anyway.
Tandem OLED display
Perhaps the most meaningful difference between the iPad Air and the iPad Pro is not the chip — it’s the display technology. The M5 uses Apple’s OLED Ultra Retina XDR display running at 120Hz with ProMotion, while the iPad Air uses the tried-and-true Liquid Retina display. It seems this is the true reason to pay the extra to upgrade into the M5, at least when listening to reviewers. They all praise the beautiful screen to the high heavens.
This is one of those categories where you have to see it to believe it. It’s impossible to show you through the screen how much better the iPad Pro M5’s screen (subjectively) is compared to the iPad Air, but think of the difference between, say, the OLED screen on your smartphone and the LCD of your desktop monitor. OLED colors are more vibrant and blacks are deeper, without that ugly gray-ish backlight that ruins dark scenes in movies. Add on the fact that OLED screens are generally more power-efficient than LCDs, and it’s clear their only disadvantage is price. OLED screen burn-in is much less of an issue than it was before, and Apple’s Tandem OLED technology actually mitigates the risk even further.
Again though, does this actually matter? A lot of people claim they can’t even tell the difference between 60Hz and 120Hz, and those same people probably don’t notice (or don’t care) that a Liquid Retina display looks “worse.” If you’re the sort of person who doesn’t find yourself caring how your screens look — your smartphone, TV, desktop monitor — then the M5 Pro’s OLED display probably won’t wow you enough to justify its price.
Face ID
Apple likely knows that the iPad Pro is a hard sell for the average person who has no “Pro” intentions, and it seems to reserve the dealbreaker features for the Pro models in the hope of upselling you. One area where it does this, in our view, is the M5 Pro’s full Face ID support. The iPad Air only supports Touch ID via the power button’s fingerprint sensor. This is a bigger deal than it might seem.
For one, the Touch ID sensor on the iPad Air is not very good, anecdotally speaking. It rarely works, often failing and forcing you to fall back on the passcode. Just setting it up with a fingerprint in the first place is a nightmare; even that fails and may take several attempts to register a single digit. I know I’m not alone, since online forums are filled with people saying their Touch ID is unreliable to the point of uselessness. Apple seems to also tacitly admit this, since there’s an entire support page dedicated to all the ways a non-responsive Touch ID sensor can be troubleshot.
For another thing, Face ID is plainly better for convenience, speed, and security. There’s no having to fumble around awkwardly for the Touch ID button when you temporarily forget where it is in your current orientation. Face ID is near-instant, works even when it’s pitch-black in your room, and is considered more secure. Even so, it’s a huge shame that Apple reserves this feature only for the Pro models.
Thunderbolt and USB 4
Another decidedly Pro feature that the iPad Pro has over the Air is support for Thunderbolt and USB 4. In the simplest terms possible, these are high-speed standards for data transfer. You likely have a Thunderbolt port on your laptop masquerading as USB-C, especially if it’s a MacBook, and that’s what lets your external SSD move files very, very quickly or supply a USB hub with enough power and bandwidth for all your accessories and peripherals. The iPad Air has no Thunderbolt, supporting only the older USB 3 standard.
Again, the important question: Does it matter? This is going to be the one feature that the fewest people probably use, even among professionals. Since the iPad Pro only has a single USB-C port, you’re pretty heavily limited in what you can connect to it. The USB-C port is not in the ideal position for connecting things either, particularly if your iPad is propped up on a stand or smart connector keyboard like the Magic Keyboard; accessories hang off of it very precariously and make thoughts of using those accessories outside the house less enticing.
We’d wager the vast majority of people who own an iPad have never once connected a high-speed USB device to it, much less thought about doing so. Only Pros using high-speed external storage would count this a loss. iPad Air M4 users (or potential buyers), this is the weakest reason to upgrade to the M5.
Fast charging
iPads have had pretty good battery life since the very beginning. The original iPad announced in 2010 boasted 10 hours, and both the iPad Air M4 and iPad Pro M5 maintain the same battery life a decade and a half later; perhaps if the M4 Pro redesign had focused less on being razor thin, we’d be living in an alternative timeline where iPads reach 20 hours of battery life. Point is, upgrading your iPad won’t give you more battery life. Just faster charging.
Apple is a bit cagey on its spec sheets, but it appears the Air M4 supports up to 30W charging, getting a full charge in roughly 2 hours. The Pro M5 can charge to full in about an hour and a half thanks to fast charging, and perhaps even faster with a supported 60W charger. Unfortunately, only a 20W charger is included in the box (same as the Air M4), so you’d need to buy Apple’s 40W Dynamic Power Adapter with 60W Max output (pictured above) or a third-party charging adapter to realize the M5’s full charging speeds.
Having said all that, shaving 30 minutes off the charging time probably won’t change much in the grand scheme of things. Calling a full charge in an hour and a half “fast charging” is kind of a misnomer anyway; you notice it more with an iPhone, where the latest iPhone 17 Pro can get two-thirds to full in 30 minutes. Ask yourself how often you would really fast-charge an iPad. Chances are, you mostly use it in bed next to a wall anyway, so the iPad Air M4’s inferior charging speed won’t be a dealbreaker for most.
The “reverse Robin Hood” hypothesis is back, wearing a fresh econometric hat and carrying a very large number. The claim is familiar: credit card rewards programs let affluent cardholders pick the pockets of poorer consumers who pay with cash or debit. The new estimate is punchier. In a recent working paper, a group of academics argued that U.S. consumers who pay with cash and debit cards transfer roughly $30 billion annually to credit card users. Of that total, the authors estimate that $9.2 billion flows from households earning less than $150,000 per year to households earning more than that threshold.
Unsurprisingly, proponents of the Credit Card Competition Act, the Illinois Interchange Fee Prohibition Act, and a growing slate of state-level proposals have seized on the paper as fresh evidence that credit card rewards programs redistribute wealth upward. But the claim rests on some heroic assumptions about where people shop, what they buy, how merchants set prices, and whether cash is actually cheaper than cards. This post takes a more skeptical view.
The Reverse Robin Hood Story Hits a Speed Bump
The paper’s authors—Mark Egan, Gregor Matvos, Amit Seru, Lulu Wang, and Vincent Yao—deserve credit for building ambitious models and applying sophisticated econometric techniques to a pair of unusually rich datasets. In doing so, they avoid some of the more obvious methodological flaws that plagued the twoFederal Reserve Bank of Boston studies and theFederal Reserve Bank of Philadelphia study we criticized previously.
Those earlier papers advanced the familiar “reverse Robin Hood” claim: poorer consumers subsidize wealthier consumers through credit card rewards programs. As Egan et al. correctly observe, however, “[r]edistribution in the payment system requires consumers who use different payment methods to shop at the same stores.”
That is a surprisingly important point. Because the earlier studies lacked transaction-level data, they could not establish that cash-paying consumers and credit-card users were actually shopping at the same merchants. Having failed to clear that basic evidentiary hurdle, they could not demonstrate the redistribution they purported to measure.
Egan et al. at least partially solve that problem by combining firm-level card-settlement data from Fiserv—a merchant acquirer that processes card transactions—with establishment-level data from Clover, Fiserv’s point-of-sale platform. The Clover data includes card, cash, and check transactions for roughly 800,000 merchants. Using that data, the authors show that, by transaction value, credit-card users generally do not shop at the same stores as cash users.
Specifically, the authors note that, in the Clover dataset covering 2019 to 2022:
On average, cash accounts for around 11% of transaction dollars (dollar-weighted across merchants; Figure 2b). However, this masks substantial heterogeneity. For approximately two thirds of merchant-year observations, cash accounts for less than 2% of transactions. In contrast, for the one-third of merchants for which cash represents at least 2% of sales, it accounts for an average of 30% of their transactions—and for merchants in the 90th percentile, over 80%, highlighting the concentration of cash usage among a subset of merchants.
The implication is straightforward:
For the two thirds of firms where cash use is almost nonexistent, there is little scope for redistribution between cash and card users. Similarly, at firms where cash is the predominant payment method, redistribution is limited. Redistribution inherently requires a mixed payment environment, so dispersion in payment composition directly constrains the scope for cross-subsidization.
In other words, the “reverse Robin Hood” narrative about massive transfers from poorer cash users to wealthier credit-card users appears, at least initially, to stumble at the first hurdle.
The picture becomes more complicated, however—both for cash transactions, to which we will return later, and for the 89% of sales conducted through debit and credit cards. On that front, Egan et al. observe:
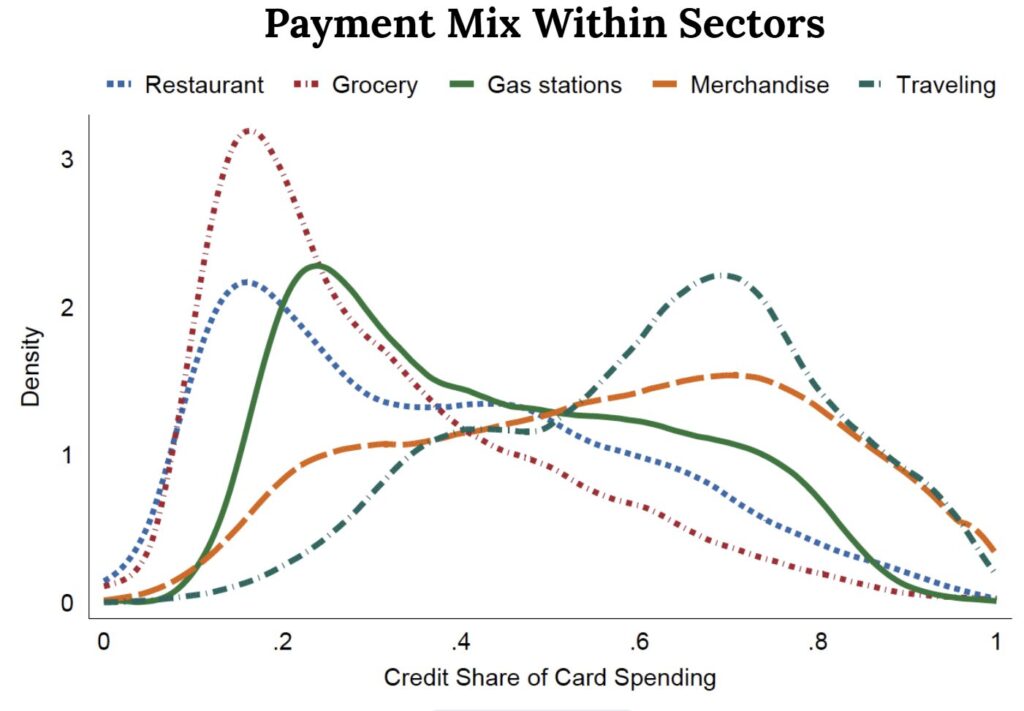
The distribution of credit card sales is bimodal, with peaks at approximately 25% and 70%. This bimodality suggests that although credit cards account for 53% of card transactions on average, merchants tend to fall into two distinct groups: those where credit accounts for around 25% of card transactions and those where it accounts for about 75%. This pattern has implications for cross-subsidization. Debit cards carry lower interchange fees and rewards relative to credit cards. Just as cash transactions can subsidize credit card rewards, debit card transactions also potentially play a subsidizing role. The bimodal nature of the distribution suggests that variation in card payment mix is significant at the merchant level—again limiting the potential for cross-subsidization, as many merchants are dominated by a single payment type.
That finding suggests there may be some opportunity for cross-subsidization from debit-card users to credit-card users, particularly in sectors where debit and cash usage remain relatively high, such as grocery stores, gas stations, and restaurants.
Even there, though, the data point toward substantial sorting among customers. The figure below shows large peaks around 20% credit-card usage, followed by a long taper. Put differently, a relatively small subset of merchants accounts for a disproportionately large share of cash and debit transactions. As the authors explain: “This dispersion is important, as it implies that even within a given sector, consumers with different payment preferences tend to shop at different merchants, reinforcing the role of sorting in shaping redistribution.”
That further narrows the scope for meaningful within-store cross-subsidization. The aggregate figures reported by Egan et al. make the redistribution story appear more sweeping than the underlying merchant-level patterns likely support.
There is another complication the paper is unable to address: variation in what consumers purchase within the same store. Cross-subsidization is more likely if consumers using different payment methods purchase goods with similar margins and pricing structures.
The available evidence suggests that higher-income and more educated consumers systematically buy different products than lower-income consumers, particularly in grocery stores. Studies consistently find that wealthier consumers tend to purchase foods marketed as healthier or more premium, for example.
Grocery stores often earn higher gross margins on premium packaged foods,private-label “wellness” products, and other differentiated items than they do on commodity staples or national-brand basics. To the extent those higher-margin products are disproportionately purchased by credit-card users, the economics may run in precisely the opposite direction from the “reverse Robin Hood” story. Credit-card users could, in effect, be subsidizing lower-margin shoppers, including debit-card users.
More fundamentally, this illustrates a broader flaw in the “reverse Robin Hood” hypothesis. The theory isolates one component of merchant costs—interchange fees—while ignoring the larger pricing ecosystem in which merchants operate. What holds for grocery stores likely applies across many retail sectors. If wealthier consumers disproportionately buy premium goods and services, merchants can recover higher interchange costs through higher margins on those purchases, eliminating any meaningful cross-subsidy.
Indeed, many businesses operate on precisely that kind of variegated-margin model. Mainstream consumers provide scale and volume, while a smaller number of premium customers generate most of the profits. Airlines are the classic example: premium cabins effectively subsidize economy seating. Grocery stores and other retailers often operate in much the same way.
The Load-Bearing Assumption
This cuts directly to the question of pass-through. Egan et al. assume that merchants pass 100% of interchange costs through to consumers in the form of higher prices, although they include a sensitivity analysis that lowers the figure to 70%. Previous studies, by contrast—including those Ben Sperry and I reviewed here—generally find pass-through rates closer to 30%.
That difference is of crucial significance because the assumed pass-through rate underpins Egan et al.’s result; it is the load-bearing assumption. The authors are explicit: “in our baseline implementation of the sufficient statistic approach, we assume full pass-through of interchange fees to prices.” Without that assumption, the headline $30 billion redistribution estimate cannot be generated.
Their own robustness exercise underscores the point. When pass-through falls from 100% to a still-generous 70%, the estimated transfer to credit-card users shrinks by roughly one-third, to about $20 billion. The authors do not explore lower pass-through rates. Instead, they argue that the evidence supports something close to full pass-through. As discussed below, that claim is highly contestable.
The most sophisticated attempt to measure interchange pass-through directly remains Vladimir Mukharlyamov and Natasha Sarin’s study of the Durbin Amendment, which imposed price controls on debit-card interchange fees for banks with more than $10 billion in assets—so-called “covered banks.” The Durbin Amendment capped debit interchange at 0.05% plus fixed fees of $0.21 and $0.01 for fraud prevention.
Mukharlyamov and Sarin examined gasoline prices in areas with relatively high concentrations of covered banks and compared them to areas with fewer covered banks between 2009 and 2013—that is, two years before and two years after the Durbin caps took effect. They found evidence consistent with pass-through of roughly 28%, but the results were not statistically significant because gas prices were highly volatile during the period studied.
Egan et al. pursue a less direct strategy. Rather than examining prices themselves, they analyze spending patterns at restaurants. Specifically, they compare average spending per customer in ZIP codes with differing concentrations of covered-bank customers. In other words, they infer price effects indirectly through changes in demand.
One wrinkle is that the Durbin Amendment affected restaurant interchange fees in a non-linear fashion. Restaurants with small average ticket sizes sometimes saw interchange fees increase, because covered banks could apply the maximum fixed fee to all transactions. By contrast, restaurants with larger ticket sizes generally saw interchange fees fall because the capped percentage fee became a smaller share of the overall transaction.
Accounting for those effects, Egan et al. estimate that a one-percentage-point increase in interchange fees reduced restaurant sales by roughly 6.9%, which they interpret as implying approximately a 1.15% increase in average ticket size.
There is a problem, though: the paper’s pass-through framework operates at far too high a level of aggregation to capture how many merchants actually price goods and services.
Retailers and restaurants rarely apply a uniform markup across all products. Staples, entry-level products, and “traffic-driving” items are often sold at razor-thin margins—or even at a loss—to attract customers into the store. Premium goods, add-ons, discretionary purchases, and branded products typically carry much higher margins.
As a result, even if overall ticket sizes reflect some response to payment-acceptance costs, the incidence of those costs may differ dramatically depending on what consumers actually buy. If lower-income consumers disproportionately purchase staples, while higher-income credit-card users disproportionately buy premium products, desserts, alcohol, branded goods, or other high-margin items, then the effective incidence of interchange costs may be far less regressive than Egan et al. assume.
As already noted, the effect could even run in the opposite direction. Premium-product purchasers might bear more of the relevant costs, producing a “Robin Hood” effect rather than a “reverse Robin Hood” effect. This is a form of within-merchant sorting that the paper’s merchant-level framework cannot adequately capture.
The problem becomes especially acute in the paper’s restaurant analysis. Egan et al. do not observe menu prices or item-level purchases. Instead, they use average transaction size as a proxy for price.
But average ticket size can change for many reasons unrelated to price pass-through. Party size can change. Consumers may order more alcohol or desserts. More customers may dine in rather than order takeout. Tips may rise. The customer mix may shift. Payment-method composition may change. Most importantly for present purposes, credit-card users may simply purchase different products than debit-card users.
A rise or fall in average ticket size therefore cannot establish, by itself, that merchants adjusted menu prices one-for-one with interchange costs. It may instead reflect changes in purchasing composition or customer behavior. That is a significant limitation because the restaurant analysis serves as the paper’s principal evidence for broader claims about systemwide pass-through.
The paper also gives insufficient weight to the benefits merchants receive from accepting credit cards. Egan et al. largely treat interchange as a pure cost imposed on merchants and passed through to consumers. But credit cards also create substantial merchant-side benefits.
Most importantly, credit cards relax liquidity constraints. A cash user can spend only the money in her wallet. A debit-card user can spend only the funds available in her bank account. A credit-card user, by contrast, can spend against an available credit line. That can increase ticket size, facilitate larger purchases, and support higher-margin sales.
Interchange revenue also helps fund the bundle of features that makes credit cards attractive to consumers: fraud protection, zero-liability policies, chargeback systems, interest-free grace periods, rewards programs, purchase protection, travel insurance, and rental-car coverage.
Those features are not merely transfers to cardholders, as Egan et al. often imply. They also generate benefits for merchants who accept credit cards. The features encourage consumers to use credit cards, which may increase merchant profits. Analyses of payment systems have long recognized merchant benefits such as ticket lift, faster checkout, lower cash-handling costs, and reduced theft or skimming risk.
A real-world example illustrates the point. In 2018, Atlanta’s Mercedes-Benz Stadium became the first major U.S. sports venue to operate entirely cash-free. The following year, per-capita food and beverage sales rose 16%, wait times fell by 20 to 30 seconds, and operating costs declined by more than $350,000.
Similar patterns appear in grocery stores, quick-service restaurants, transit systems, and sports venues more broadly. Remove cash from the equation, and merchants often see higher revenue per customer. Yet Egan et al. treat interchange solely as a cost. They never seriously consider the possibility that merchants receive offsetting revenue benefits.
These considerations are especially important in the context of the Durbin Amendment, which capped debit-card interchange fees for covered banks, but left credit-card interchange untouched. Covered banks therefore lost much of their ability to fund debit-card rewards programs, free checking, and other debit-linked benefits.
Many banks responded exactly as one would expect: they eliminated debit-card rewards while preserving credit-card rewards. Consumers consequently had stronger incentives to shift spending from regulated debit cards to credit cards.
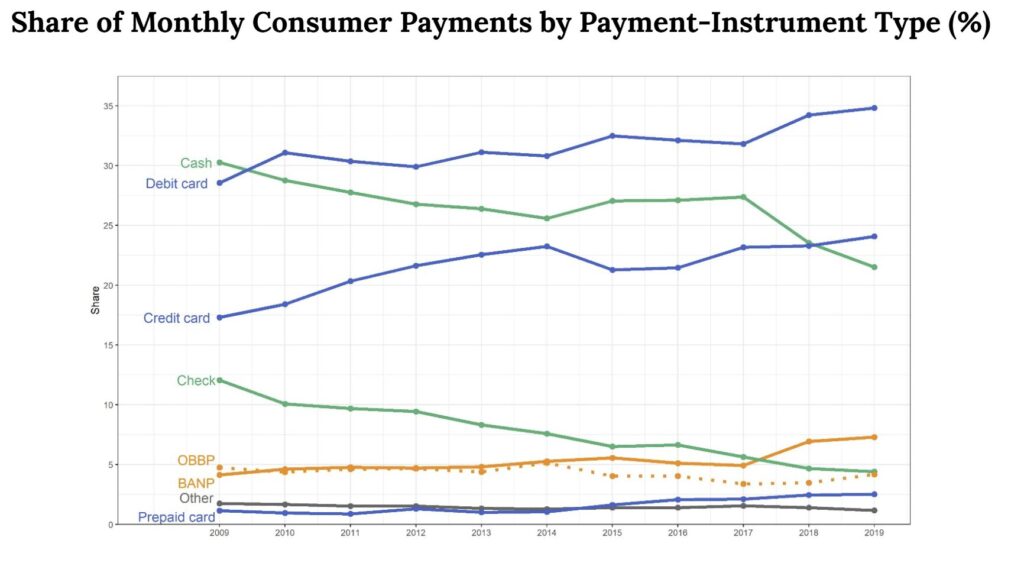
The available evidence suggests that is precisely what occurred. Federal Reserve survey data show that debit-card use declined and credit-card use rose significantly between 2010 and 2012, immediately following Durbin’s enactment, as shown in the figure below.
To the extent customers of covered banks shifted disproportionately from debit to credit, restaurants in ZIP codes with greater exposure to covered-bank customers would have experienced more than merely lower regulated-debit costs. They also may have experienced increases in credit-card usage, resulting in larger ticket sizes and other changes in purchasing behavior, including shifts toward higher-margin products.
If increased credit-card use generated ticket lift or encouraged purchases of premium goods, then some—or potentially much—of the observed revenue increase could reflect payment-method substitution rather than pass-through of lower debit interchange costs.
The upshot is that the restaurant evidence does not cleanly isolate pass-through. Instead, it may conflate several different mechanisms: the observed changes in debit acceptance costs plus unobserved shifts in payment-method use (including migration away from cash, which is unobservable because Egan et al do not have Clover data for the relevant period), ticket lift due to higher levels of credit card use in locations with greater proportions of covered banks, product-level pricing differences, and customer-composition effects.
Egan et al. assume fixed consumer payment preferences and model interchange primarily as a merchant cost passed through in a uniform way to retail prices. But if payment methods influence what consumers buy, how much they spend, and which products carry the highest margins, then the incidence of interchange becomes substantially more complicated than the paper allows.
At a minimum, average restaurant ticket sizes should not be treated as dispositive evidence of systemwide one-for-one pass-through. A convincing analysis would require item-level prices or baskets, total sales including cash transactions, and direct evidence regarding debit-to-credit substitution among customers of covered banks.
Cash Isn’t Free
Finally, let’s return to the question of cash.
Egan et al. explain that their analysis attempts to calculate transfers among different categories of payment users—and, by extension, among income groups—by comparing the current payment system to a hypothetical world with “zero interchange.” The paper correctly notes that merchants pay acquirers a merchant discount rate (MDR), which covers not only interchange fees remitted to issuing banks, but also other payment-processing costs.
The implicit assumption is that, absent interchange fees, merchants would simply pay this lower baseline MDR on all transactions. For the roughly two-thirds of merchants whose transactions are almost entirely electronic, that assumption is reasonably plausible.
For the remaining third of merchants—those where cash accounts for more than 2% of payments—it is anything but plausible. In many cases, it is simply wrong.
The reason is straightforward: cash may avoid interchange fees, but handling cash is expensive.
The most comprehensive recent study of cash-handling costs was conducted by IHL in 2018. The study identified nine major categories of cash-related expense:
Start/rebuild drawer costs associated with opening and resetting cash drawers;
Closing-drawer reconciliation and counting;
Cash pickups during shifts;
Change-order management;
Audits and discrepancy resolution;
Preparing and coordinating deposits;
Cash-in-transit and bank-deposit costs;
Bank fees and related charges; and
Cash shrink, including theft, fraud, and unexplained losses.
Once those costs are fully accounted for, IHL estimated that cash handling costs merchants between 4% and 15% of transaction value.
By comparison, the only directly comparable costs for electronic payments are cashier time during payment acceptance and certain bank-service fees that supplement the merchant discount rate. In most cases, the all-in cost of cash transactions equals or exceeds the cost of debit or credit transactions.
Earlier work points in the same direction. Daniel D. Garcia-Swartz, Robert W. Hahn, and Anne Layne-Farrar found that, for typical grocery-store purchases, cash transactions cost more than either credit or debit transactions. Even for transactions as small as $12, cash cost roughly the same as credit and more than debit.
More recent research reaches similar conclusions. The Federal Reserve Bank of San Francisco’s 2019 paper “Cash Me If You Can” concluded that “cashless operations help businesses save on cash handling costs, reduce exposure to theft, and increase the speed of transactions.”
Our own review reached the same bottom line: once all parties to the transaction are considered, electronic payments are generally less costly than cash for most transactions—not the other way around.
That makes Egan et al.’s suggestion that cash users subsidize credit- and debit-card users difficult to sustain. If anything, the economics more likely run in the opposite direction.
The paper’s accounting problem extends beyond merchant costs. Egan et al. also omit—or treat merely as transfers—a long list of benefits funded through interchange revenue.
Those benefits include the fraud-liability protections established under Regulation Z, which caps consumer liability for unauthorized credit-card transactions at $50 and, in practice, usually at zero. They include chargeback and dispute-resolution systems that function as a form of purchase insurance unavailable to cash users or users of direct bank-transfer systems.
They also include the interest-free grace period attached to credit cards. Consumers who pay their balances in full each month effectively receive a short-term, unsecured, zero-interest loan. That is not a trivial convenience. For many lower-income households managing uneven cash flow, it is a genuinely valuable financial tool—and one available regardless of income, FICO score, or financial sophistication.
Credit cards also provide emergency access to liquidity. An available credit line can function as a substitute for precautionary savings, which matters most for households with limited liquid assets.
Then there is the infrastructure itself. Interchange revenue helps fund tokenization, EMV chip technology, contactless payments, 3D Secure authentication, real-time fraud detection, and the broader payment-network innovations consumers now take for granted.
For the very populations the “reverse Robin Hood” narrative purports to protect, these are not incidental benefits. They are first-order features of the system.
A redistribution analysis that ignores them is not merely incomplete. It is measuring the wrong thing altogether.
The Reverse Robin Hood Story Has It Backwards
Putting all this together, the “reverse Robin Hood” story largely falls apart. There may be some degree of cross-subsidization from debit-card users to credit-card users, driven in significant part by the distortions introduced by the Durbin Amendment. But the much larger effect likely runs in the opposite direction: from electronic-payment users to cash users.
Because cash transactions are disproportionately associated with lower-income consumers, that dynamic looks a lot more like Robin Hood than reverse Robin Hood. Wealthier consumers who use premium credit cards help fund a payments ecosystem that lowers costs and expands functionality for everyone else.
So how do Egan et al. arrive at such a different conclusion?
Part of the answer appears on the opening page of the paper itself. The authors argue that: “Existing debates often frame interchange as either a ‘tax’ on merchants or a mechanism to fund consumer rewards. Both views overlook that interchange fees primarily redistribute consumption across consumers …” (p.1).
But that framing omits a crucial fourth possibility—one the authors themselves acknowledge later in the paper:
Fee variation across sectors reflects Visa’s and Mastercard’s attempts to balance merchant acceptance versus issuer incentives, trading off participation on both sides of the platform.
That is not some secondary observation buried in the weeds. It is the core economic logic of payment-card networks.
Ever since William Baxter’s seminal 1983 work, economists have understood payment systems as classic two-sided markets. Jean-Charles Rochet and Jean Tirole later formalized the insight. Payment networks must attract both merchants and consumers simultaneously. Interchange fees function as the balancing mechanism that keeps both sides participating.
The goal is not redistribution for its own sake. The goal is maximizing the value of the platform across both sides of the market.
Merchants receive faster checkout, higher throughput, lower cash-handling costs, fraud protection, guaranteed payment, and larger ticket sizes. Consumers receive convenience, security, recordkeeping, zero-liability protection, access to credit, and—in the case of premium credit cards—rewards and ancillary benefits that make card use more attractive.
Interchange is the mechanism that funds that ecosystem. It supports issuer investment, fraud prevention, credit risk management, and the incentives that encourage consumers to adopt electronic payments in the first place.
That pricing structure has played a central role in the remarkable migration away from paper-based payments over the past two decades. Cash and checks have steadily given way to cards because electronic payments became faster, safer, more convenient, and often less costly for both sides of the transaction.
Federal Reserve data show the trend continuing. Cards accounted for roughly 66% of transactions in 2025, up from 45% in 2009. Cash usage, meanwhile, fell from roughly 30% to just 13%.
Premium credit cards have been an important driver of that transition. Higher-value cards use interchange revenue to fund rewards, insurance, fraud protections, and related benefits that induce consumers to participate more heavily in electronic-payment systems. Greater consumer demand, in turn, increases the value of card acceptance to merchants, encouraging adoption of innovations such as contactless payments and increasingly cashless retail environments.
That dynamic remains important because cash still retains advantages for some consumers and some transactions. As the Federal Reserve recently observed:
Despite a small decline from last year, the consistent use of cash year-over-year shows there are certain transactions where people want or need to use cash. This is likely due to several unique characteristics of cash payments that other payment options have yet to fully replicate, such as anonymity, widespread acceptance, instant settlement and reliability as a secondary payment instrument.
In other words, the migration away from cash is incomplete. Premium credit—and potentially more competitive debit products—still plays an important role in encouraging consumers to adopt electronic payments and helping merchants move away from expensive cash-handling systems.
Indeed, one implication of this analysis is that policymakers should seriously reconsider the Durbin Amendment itself, or at minimum relax the Federal Reserve’s interchange caps on covered banks. Doing so would allow debit cards to compete more effectively against both credit cards and cash.
That could benefit lower-income consumers directly through expanded checking-account access and richer debit-card rewards, both of which would promote financial inclusion and reduce reliance on cash. Merchants would benefit as well if more consumers shifted back toward debit, which generally carries lower acceptance costs than credit.
The irony, then, is that the policies sold as fixes for “reverse Robin Hood” redistribution may well undermine one of the most successful financial-inclusion and payments-modernization systems ever created. Sometimes the supposed subsidy story turns out to be the reverse.
To provide the best experiences, we use technologies like cookies to store and/or access device information. Consenting to these technologies will allow us to process data such as browsing behavior or unique IDs on this site. Not consenting or withdrawing consent, may adversely affect certain features and functions.
Functional
Always active
The technical storage or access is strictly necessary for the legitimate purpose of enabling the use of a specific service explicitly requested by the subscriber or user, or for the sole purpose of carrying out the transmission of a communication over an electronic communications network.
Preferences
The technical storage or access is necessary for the legitimate purpose of storing preferences that are not requested by the subscriber or user.
Statistics
The technical storage or access that is used exclusively for statistical purposes.The technical storage or access that is used exclusively for anonymous statistical purposes. Without a subpoena, voluntary compliance on the part of your Internet Service Provider, or additional records from a third party, information stored or retrieved for this purpose alone cannot usually be used to identify you.
Marketing
The technical storage or access is required to create user profiles to send advertising, or to track the user on a website or across several websites for similar marketing purposes.