Container made it easy to run Linux on my MacBook – here’s how I set it up


containerhero

Jack Wallen/ZDNET

Follow ZDNET: Add us as a preferred source on Google.


ZDNET’s key takeaways

  • Container is a solid tool to develop for Linux on MacOS.
  • It deploys lightweight Linux containers on Apple silicon.
  • Container is a free command-line tool.

I’ve used all sorts of container tools over the years: Docker, Docker Desktop, Podman, Portainer… the list goes on. Most of my container work has been handled on various Linux machines, but every once in a while, I want to work with my MacBook. Either way, I’ve found there are always choices.

My first choice (when using my MacBook) is to SSH into a Linux machine and work from the command line. But what happens when I don’t have a network available (or I’m away from my home)?

Well, there’s a new version of the command-line tool for MacOS, called Container, that is just as good as the tools I’ve used on Linux. 

Container has been around since 2025 and is a handy piece of software that allows you to create and run Linux containers as lightweight virtual machines on your MacOS Apple silicon-powered machine. The latest release of Container is optimized specifically for Apple Silicon Mac hardware. If you’ve ever used the Docker command-line tool, you’ll feel right at home with Container. 

Also: The best Linux distributions for beginners: Expert tested and reviewed

The difference between Container and Docker is that with Container, each container runs in its own lightweight virtual machine and is launched using a Swift-based init system (vminitd). Container is fast and will be familiar to anyone who has previously worked with tools like Docker or Podman.

I’m going to walk you through the installation and usage of Container on a MacBook, but it can be installed on any desktop or laptop running Apple silicon.

Installing Container

Installing Container is simple.

Once the file has downloaded, double-click it to launch the user-friendly installation Wizard. Walk through the simple steps until the installation is complete.


Show more

Container

Installing Container is much easier than you might think.

Jack Wallen/ZDNET

That’s all there is to installing Container.

Using Container

Now we get to the fun part. 

I’m going to demonstrate how to deploy a simple web server that’ll serve a Hello page, displaying “Hello, ZDNET!”.

1. Start Container

The first thing you must do is start the Container system, which is done with the command:

container system start

You should see no errors in the output. To verify the system has started, run the command to list all running containers (of which there are currently none). That command is:

container list –all

The output of the above command will be:

ID  IMAGE  OS  ARCH  STATE  IP

If you see that, Container is successfully running and ready to go.

2. Build your first image

If you know anything about containers, you understand that everything starts with an image. If you’ve never used containers, think of an image as a stripped-down operating system that contains only what you need to run a particular container. 

Also: Linux will be unstoppable in 2026 – but one open-source legend may not survive

The first thing you’ll want to do is create a directory to house our little project. Do that with the command:

mkdir hello-web

Change into that new directory with the command:

cd hello-web

The next step is to create a Dockerfile that will contain all of the necessary configurations for our Hello web server. Create the file with the command:

nano Dockerfile

In that file, paste the following contents:

FROM docker.io/python:alpine
WORKDIR /content
RUN apk add curl
RUN echo ‘<!DOCTYPE html><html><head><title>Hello</title></head><body><h1>Hello, ZDNET!</h1></body></html>’ > index.html
CMD [“python3”, “-m”, “http.server”, “80”, “–bind”, “0.0.0.0”]

Save and close the file with the keyboard shortcut Ctrl+X.

Let’s break down the above:

  • FROM — This instructs Container what remote image to pull that will be used as our base.
  • WORKDIR — This is the directory (that will be created within our hello-web directory) that will house everything.
  • RUN — This is the first command that will be run within the image and installs the curl app.
  • RUN — This is the second command that creates the index.html file that includes the Hello, ZNDET! text that will be displayed in the H1 format.
  • CMD — This command configures the web server to run on port 80 and use the 0.0.0.0 address (so it’s accessible to your web browser).

Next, we have to build our new image that will be used to create the web server container. This is done with the command:

container build –tag hello-web –file Dockerfile .

3. Deploy the web server

With the image built, we can now deploy the web server with the command:

container run –name hello-web-server –detach hello-web

The above command deploys a container named hello-web-server in the background (by way of the –detach option) using the hello-web image.

4. Viewing your deployed Hello web page

To view your newly deployed web page, you first need to locate the IP address it is using. To do that, issue the command:
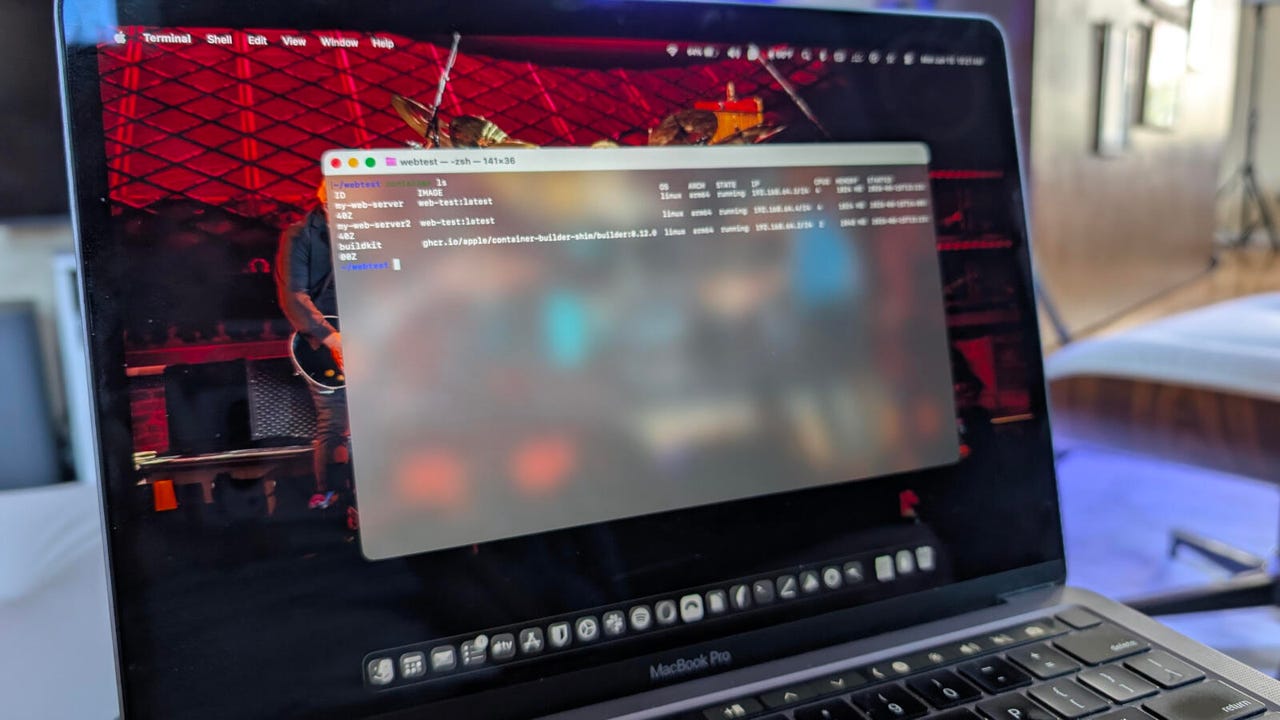
container ls

You should see something like this in the output:

hello-web-server   hello-web:latest linux  arm64  running  192.168.64.3/24  4     1024 MB  2026-06-15T13:23:40Z

The IP address for the above hello-web-server container is 192.168.64.3. If you open your browser and point it to that address, you should see Hello, ZDNET! on the page.

Container

Jack Wallen/ZDNET

Congratulations, you just deployed your first container using the Apple silicon-optimized container tool.

Also: How to connect to a VirtualBox virtual machine from your LAN

Although this isn’t a point-and-click-friendly tool, there are GUIs, such as ContainerKit, that are in heavy development. There are currently no installable releases for ContainerKit, but you can be certain there will be in the near future. As well, there will be other GUI apps that will eventually appear to help make this tool even easier.


Source link

Leave a Reply

Subscribe to Our Newsletter

Get our latest articles delivered straight to your inbox. No spam, we promise.

Recent Reviews


Another day, another politically motivated attack in the United States.

This morning’s shooting at a Dallas ICE detention facility – where a sniper killed two detainees and wounded another before taking his own life prompted me to revisit a question that’s been troubling me: Is political violence actually increasing in America, or does it just feel that way?

To explore this, I’ve conducted what I’ll call a methodological experiment.

Rather than relying on traditional datasets, I’ve used ChatGPT and Claude to construct a synthetic index of political violence in the US since 1945. Let me be absolutely clear: this isn’t conventional data. It’s data generated through language models, with all the limitations that implies.

The Methodology (and Its Limitations)

Here’s what I did: I asked both ChatGPT and Claude to generate lists of politically motivated violent incidents since 1945, then had them score each incident’s severity on a scale where 50 represents a “normal” level.

The models assessed both casualties and symbolic significance, and I used them to cross-check each other’s work. I then quality-checked the output myself and categorised perpetrators by political affiliation where this was clearly established.

This approach is, admittedly, unorthodox. Language models are trained on existing texts and may reflect biases in their training data. They might overweight highly publicised events or recent incidents that featured prominently in their training corpus.

The “data” we’re looking at is essentially a structured synthesis of what these models have absorbed about American political violence.

Yet there’s something intriguing here. These models have processed vast amounts of information about political violence – news reports, academic studies, government documents. Their output might capture patterns that traditional datasets miss, though it might also amplify certain narratives or blind spots.

What the Synthetic Data Reveal

With those caveats firmly in mind, the patterns that emerge from this exercise are concerning. The model-generated index shows a clear upward trend in political violence over the past decade.

Looking at the breakdown by perpetrator ideology (where clearly established), the data suggest that right-wing extremist groups have been responsible for the majority of incidents in recent years, though we cannot draw conclusions about today’s attack whilst investigations are ongoing.

The synthetic data align with some empirical observations. Princeton’s Bridging Divides Initiative recorded over 600 incidents of threats and harassment against local officials in 2024 – a 74% increase from 2022. The University of Maryland found that in the first half of 2025, 35% of violent events targeted U.S. government personnel or facilities – more than twice the rate in 2024.

The Charlie Kirk Assassination and Recent Patterns

The September assassination of conservative activist Charlie Kirk marked a particularly dark moment.

The incident followed numerous recent acts of political violence, including the murder of Minnesota Democratic state Rep. Melissa Hortman and her husband, and two assassination attempts on President Trump in 2024.

What the synthetic data reveal is not just increased frequency but a shift in patterns. While overall levels of physical political violence remained low in 2024 compared to years prior, acts of vigilante violence grew as a proportion of all reported incidents.

We’re seeing less organised group violence and more lone-wolf attacks – a pattern that’s harder to predict and prevent.

The Epistemological Challenge

When we use language models to generate “data” about social phenomena, what exactly are we measuring? We’re essentially extracting structured information from the collective corpus of human writing about these events. It’s aggregating distributed information, but through an AI intermediary rather than traditional data collection methods.

This raises fascinating questions.

The models suggest that right-wing extremist violence has been responsible for a fairly large majority of U.S. domestic terrorism deaths since 2001. But how much of this reflects actual patterns versus the way these events are covered and discussed in the sources the models were trained on?

The synthetic data are, in a sense, a mirror of our collective discourse about political violence. They reflect not just what happened, but how we’ve talked about what happened. That’s both a limitation and, potentially, a feature – understanding the narrative landscape around political violence might be as important as counting incidents.

An Experimental Tool

I’ve built an interactive app (using the AI coding tool Lovable) based on this language model-generated violence index.

Users can explore the synthetic data, examine patterns across different time periods and perpetrator groups, and understand the methodology behind it. Think of it as an experiment in using AI to structure historical information rather than a definitive dataset.

The value isn’t in treating this as gospel truth, but in what it reveals about how these events are recorded, remembered, and synthesised in our collective digital memory.

When language models trained on our civilisation’s text output show rising political violence, it tells us something – even if that something is as much about narrative as about underlying reality.

This morning’s tragedy in Dallas reminds us that behind every data point – whether traditionally collected or AI-generated – there are real victims and real consequences. Understanding the patterns, however imperfectly, is the first step toward addressing them.

Try the tool here.


Source link