Why We’re Scrambling to Buy Cheaper Eggs


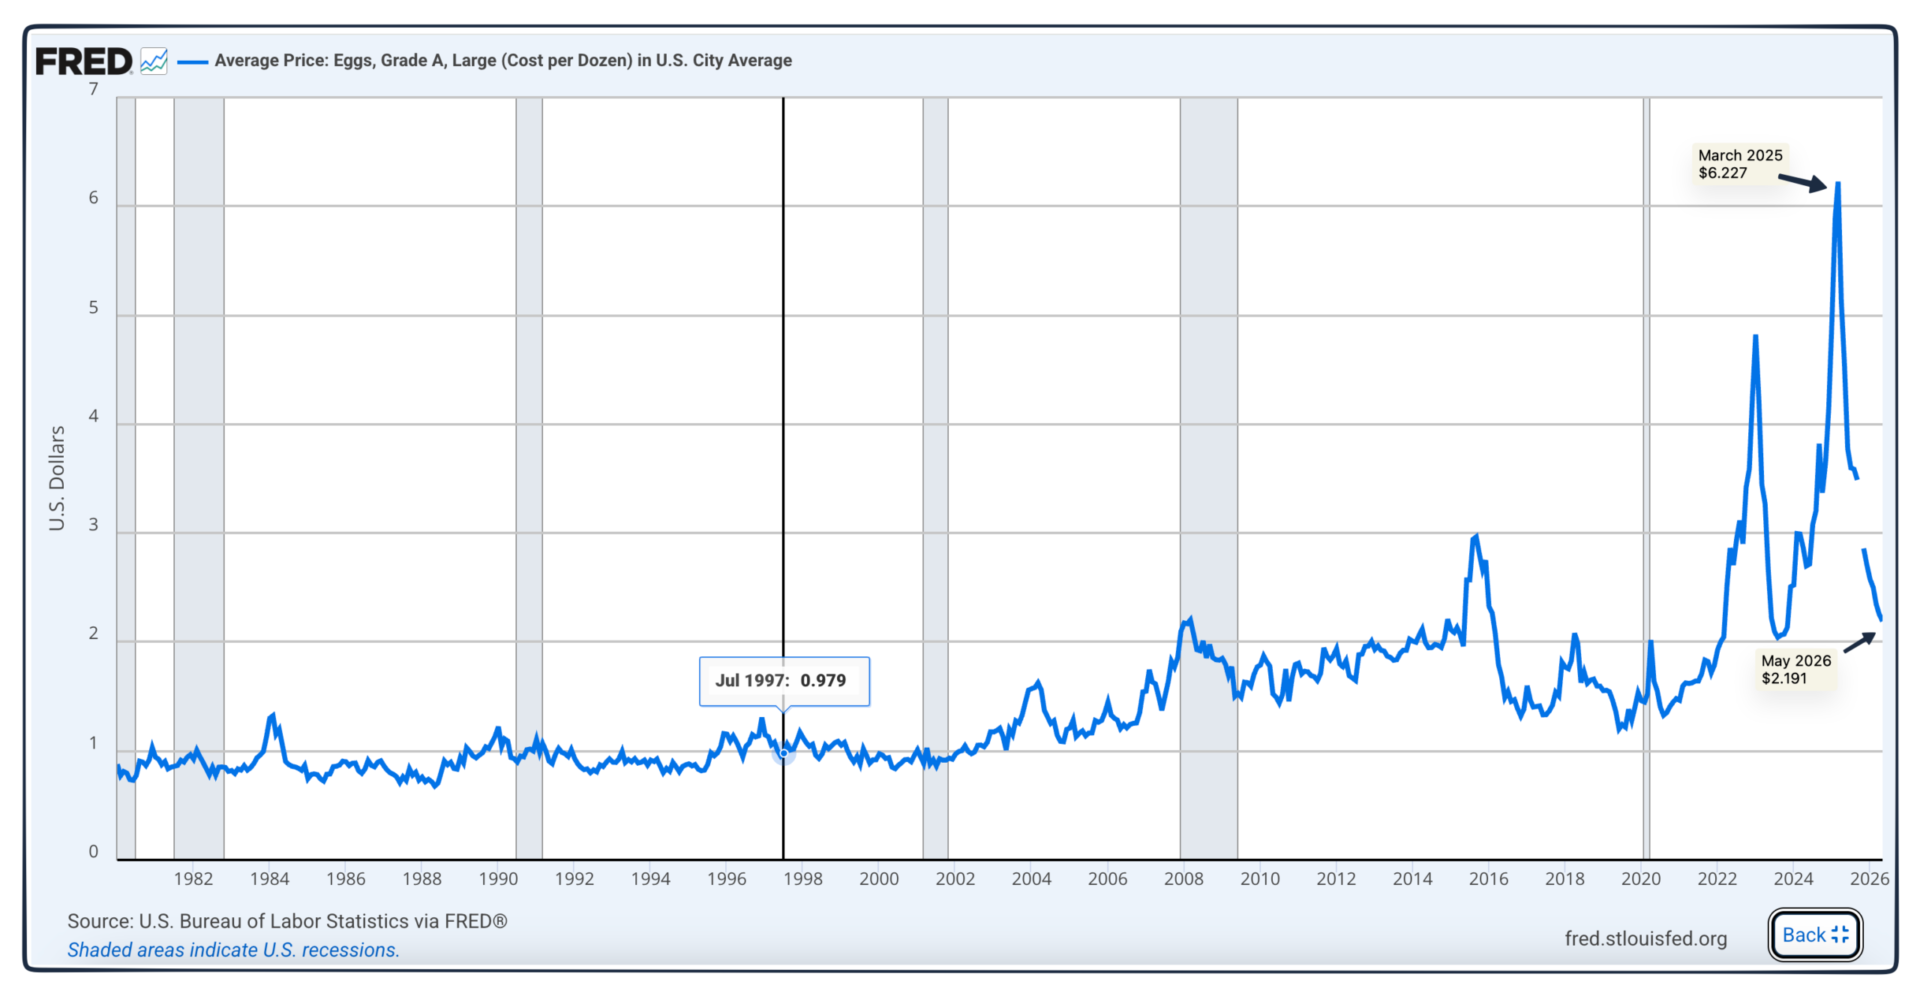
Plunging from recent highs, egg prices are way down:

egg prices

Before we look at why, let’s start with some egg facts.

What We Always Wanted To Know About Eggs

You might have always wondered which came first, the chicken or the egg. According to food guru Harold McGee, it was the egg. The first eggs date back 250 million years ago from reptiles that moved from a watery home to the land. Then, approximately 100 million years later, birds evolved. After that, only 4 or 5 thousand years ago, we got the modern chicken.

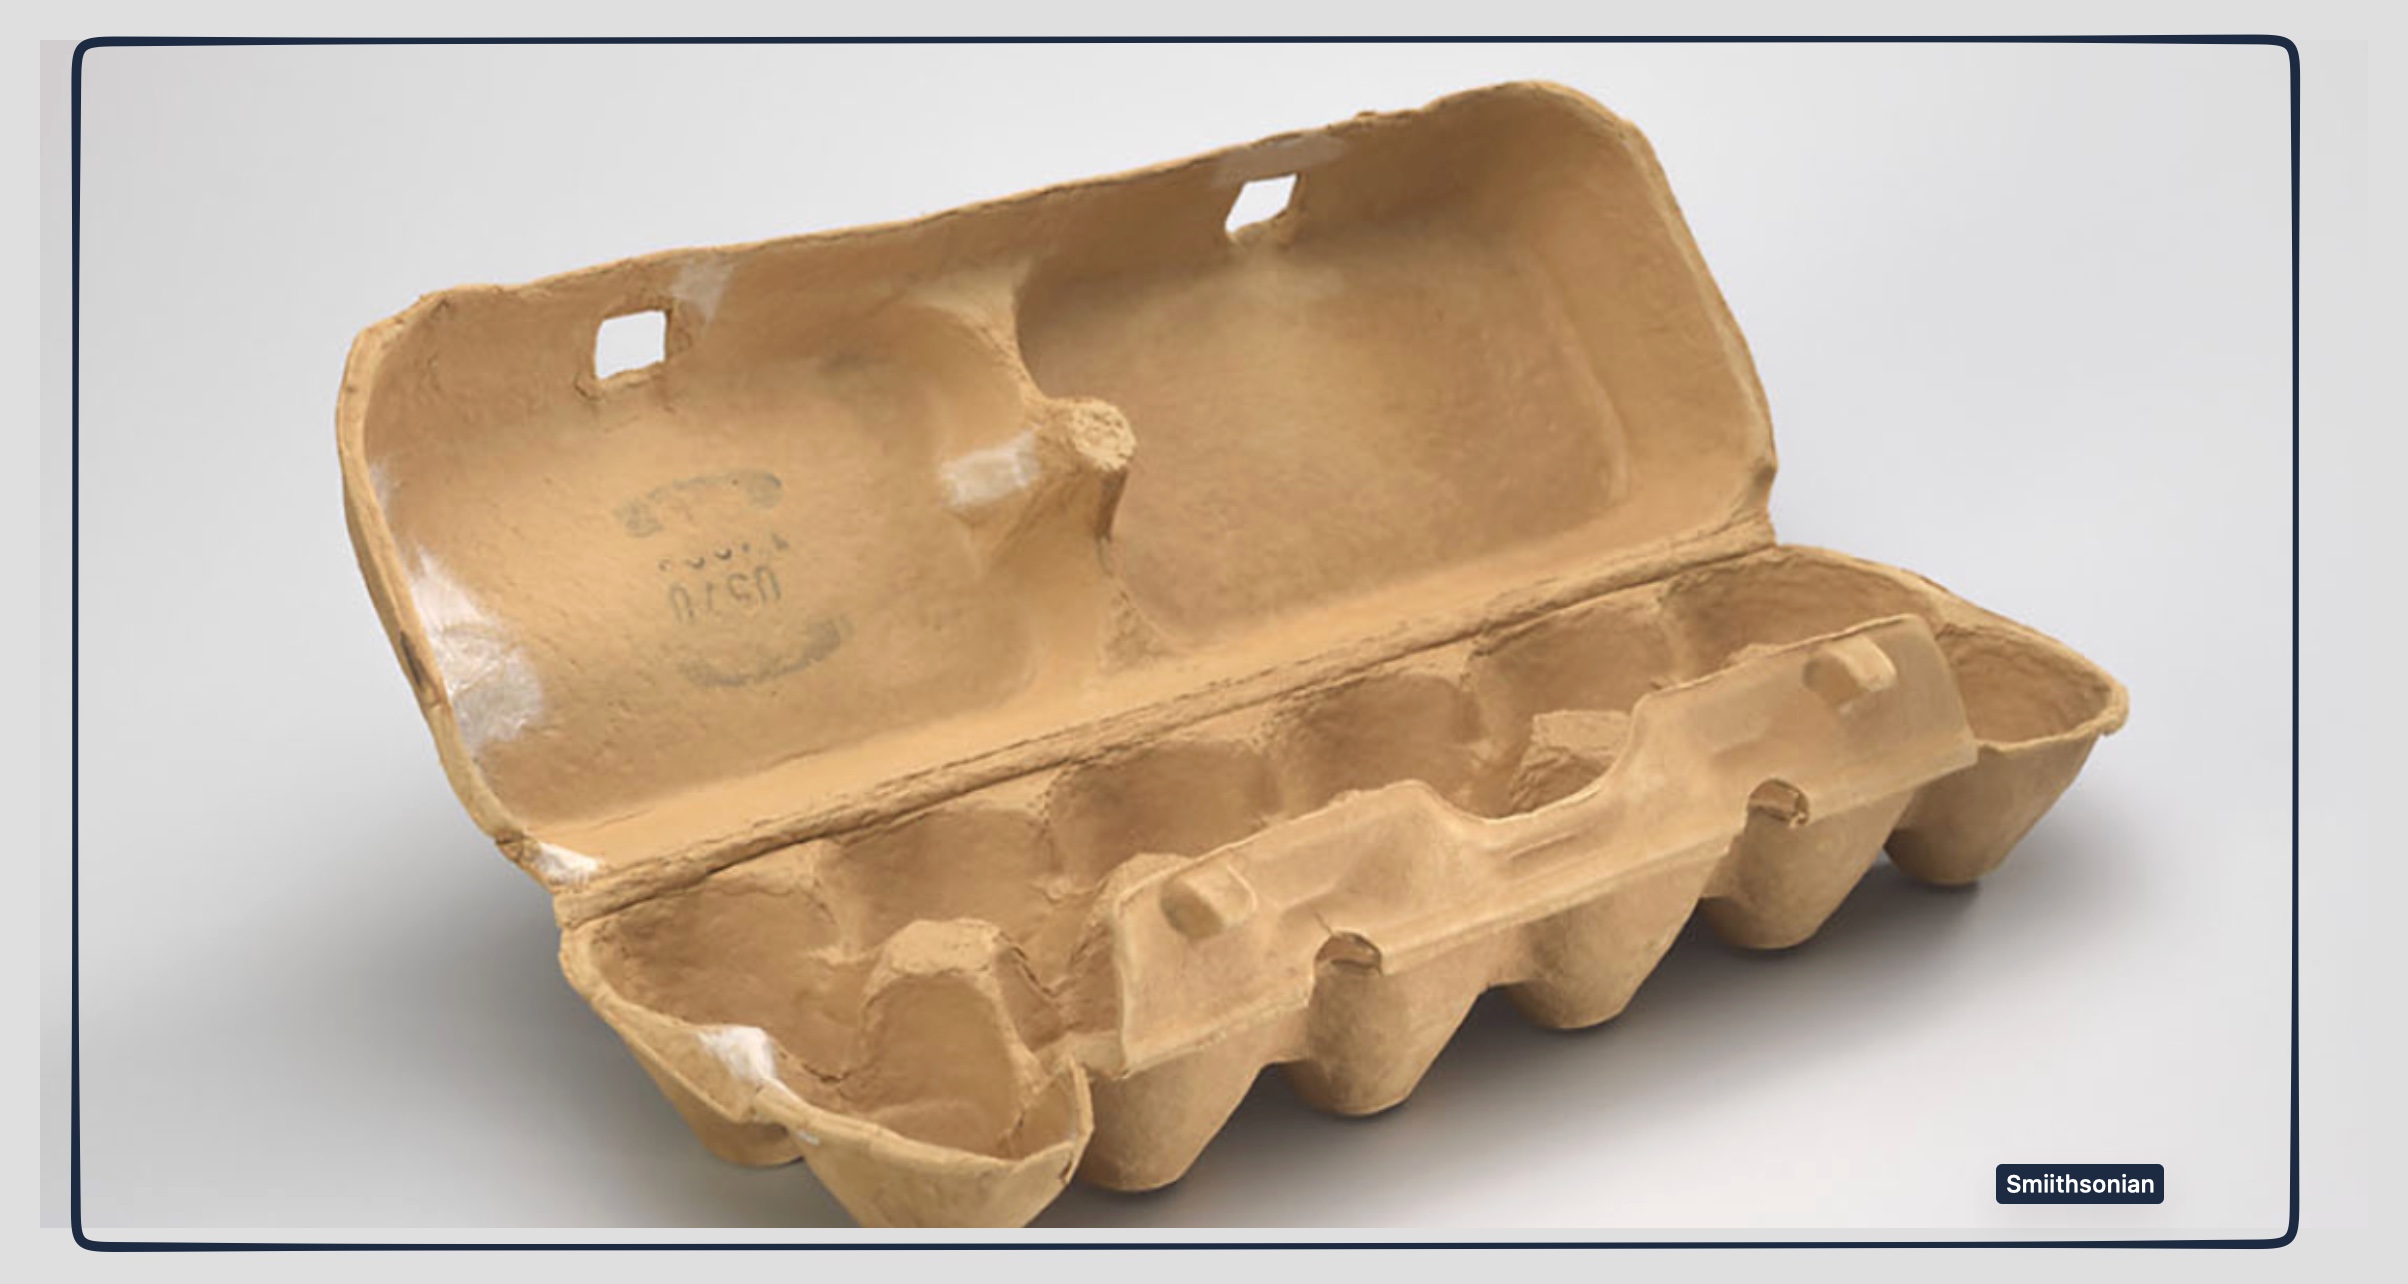
Also, I suspect that, like me, you’ve taken the modern egg carton for granted. However, as one of those everyday inventions we ignore, it played an eg-citing (sorry-could not resist) role. Mass producing the modern egg, someone had to solve a breakage problem. The result was the modern egg carton:

egg prices

Before we had egg cartons, one railway delivery service said breakage claims totaled $100,000 a month (equal to $1.5 million today). At that time, they packed eggs in wooden crates or baskets or tubs. One crate was called the Humpty Dumpty:

egg prices

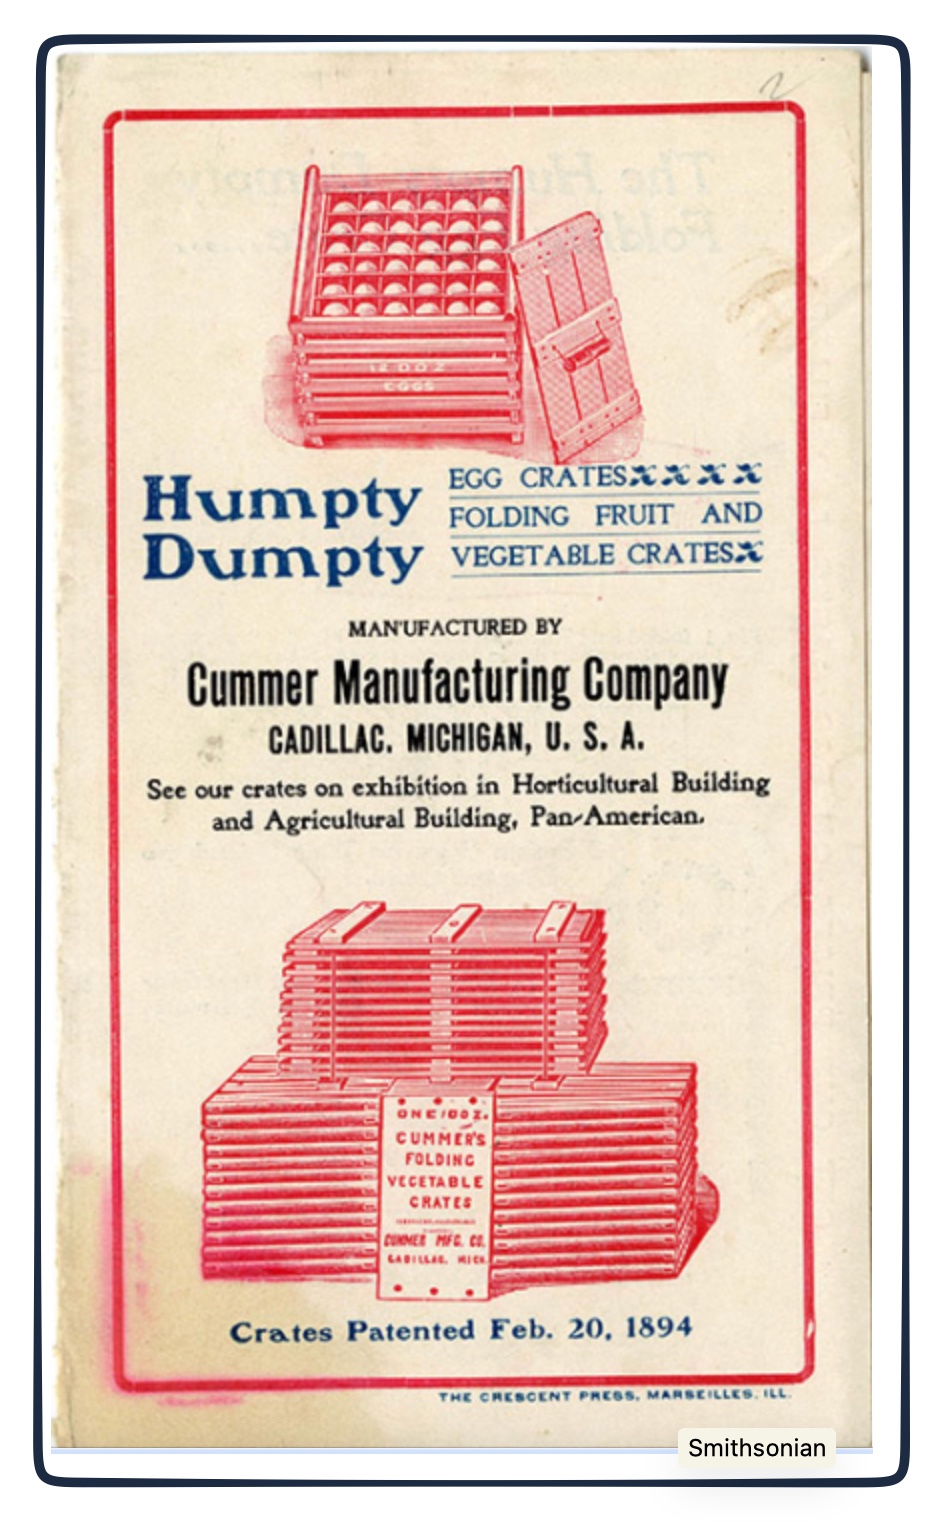
A Smithsonian article told us why egg packaging was so important. As they explained, the newer containers facilitated “less waste from spoiling, better handling, efficiencies in storing and display on store shelves, quicker sales with less weighing and wrapping, and standardization and uniformity. And, the package itself could advertise the product with printed logos and slogans of manufacturers and the selling agents.”

Consequently, advances in paper manufacture led to a series of increasingly better egg cartons. We got the first egg carton that we would recognize in 1926.

Our Bottom Line: Egg Prices

The egg price plunge is a supply and demand story. After the scourge of bird flu wiped out millions of chickens, farmers restored their flocks. As a result, now, we have 9 million more hens laying eggs than last year. And that’s too many.

Meanwhile, on the demand side of egg markets, consumers are displaying a protein bump. Traditionally, egg consumption has been inelastic. As economists, we know that we are referring to our minimal response to a price change.

Analytically, we are comparing the proportional change in quantity (numerator) to the proportional change in price (denominator). If the quantity’s percent change is bigger, then the item is elastic. By contrast, we have inelasticity when our denominator is larger because the percent change in price was bigger. Egg consumption is traditionally inelastic. As a result, because of our surging protein quest we need to shift our inelastic demand curve to the right.

Below, I’ve increased supply and demand. The new black lines meet at a lower egg equilibrium price:

plunging egg prices

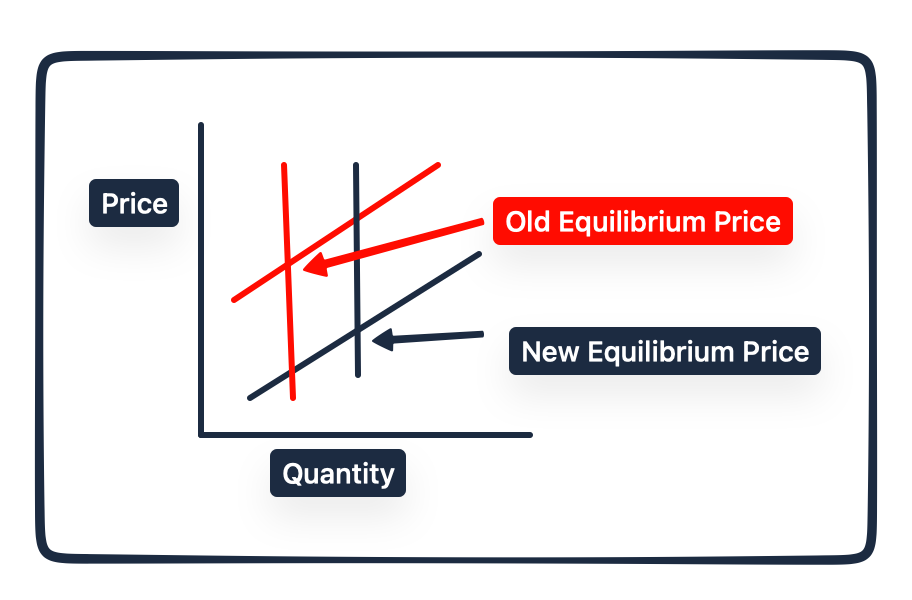
In wholesale markets, at 90% less, farmers were getting 70 cents a dozen. So while you and I are happy with lower egg prices, farmers are not.

Maybe though, one graph tells the whole egg price story (and why we are scrambling to buy more eggs).

My sources and more: We started today’s post with this NY Times article. From there, for the ideal sources of egg and poultry insight, we went here, here, and here. Also, you might enjoy this Odd Lots podcast series, “Beak Capitalism.”

The post Why We’re Scrambling to Buy Cheaper Eggs appeared first on Econlife.


Source link

Leave a Reply

Subscribe to Our Newsletter

Get our latest articles delivered straight to your inbox. No spam, we promise.

Recent Reviews


Another day, another politically motivated attack in the United States.

This morning’s shooting at a Dallas ICE detention facility – where a sniper killed two detainees and wounded another before taking his own life prompted me to revisit a question that’s been troubling me: Is political violence actually increasing in America, or does it just feel that way?

To explore this, I’ve conducted what I’ll call a methodological experiment.

Rather than relying on traditional datasets, I’ve used ChatGPT and Claude to construct a synthetic index of political violence in the US since 1945. Let me be absolutely clear: this isn’t conventional data. It’s data generated through language models, with all the limitations that implies.

The Methodology (and Its Limitations)

Here’s what I did: I asked both ChatGPT and Claude to generate lists of politically motivated violent incidents since 1945, then had them score each incident’s severity on a scale where 50 represents a “normal” level.

The models assessed both casualties and symbolic significance, and I used them to cross-check each other’s work. I then quality-checked the output myself and categorised perpetrators by political affiliation where this was clearly established.

This approach is, admittedly, unorthodox. Language models are trained on existing texts and may reflect biases in their training data. They might overweight highly publicised events or recent incidents that featured prominently in their training corpus.

The “data” we’re looking at is essentially a structured synthesis of what these models have absorbed about American political violence.

Yet there’s something intriguing here. These models have processed vast amounts of information about political violence – news reports, academic studies, government documents. Their output might capture patterns that traditional datasets miss, though it might also amplify certain narratives or blind spots.

What the Synthetic Data Reveal

With those caveats firmly in mind, the patterns that emerge from this exercise are concerning. The model-generated index shows a clear upward trend in political violence over the past decade.

Looking at the breakdown by perpetrator ideology (where clearly established), the data suggest that right-wing extremist groups have been responsible for the majority of incidents in recent years, though we cannot draw conclusions about today’s attack whilst investigations are ongoing.

The synthetic data align with some empirical observations. Princeton’s Bridging Divides Initiative recorded over 600 incidents of threats and harassment against local officials in 2024 – a 74% increase from 2022. The University of Maryland found that in the first half of 2025, 35% of violent events targeted U.S. government personnel or facilities – more than twice the rate in 2024.

The Charlie Kirk Assassination and Recent Patterns

The September assassination of conservative activist Charlie Kirk marked a particularly dark moment.

The incident followed numerous recent acts of political violence, including the murder of Minnesota Democratic state Rep. Melissa Hortman and her husband, and two assassination attempts on President Trump in 2024.

What the synthetic data reveal is not just increased frequency but a shift in patterns. While overall levels of physical political violence remained low in 2024 compared to years prior, acts of vigilante violence grew as a proportion of all reported incidents.

We’re seeing less organised group violence and more lone-wolf attacks – a pattern that’s harder to predict and prevent.

The Epistemological Challenge

When we use language models to generate “data” about social phenomena, what exactly are we measuring? We’re essentially extracting structured information from the collective corpus of human writing about these events. It’s aggregating distributed information, but through an AI intermediary rather than traditional data collection methods.

This raises fascinating questions.

The models suggest that right-wing extremist violence has been responsible for a fairly large majority of U.S. domestic terrorism deaths since 2001. But how much of this reflects actual patterns versus the way these events are covered and discussed in the sources the models were trained on?

The synthetic data are, in a sense, a mirror of our collective discourse about political violence. They reflect not just what happened, but how we’ve talked about what happened. That’s both a limitation and, potentially, a feature – understanding the narrative landscape around political violence might be as important as counting incidents.

An Experimental Tool

I’ve built an interactive app (using the AI coding tool Lovable) based on this language model-generated violence index.

Users can explore the synthetic data, examine patterns across different time periods and perpetrator groups, and understand the methodology behind it. Think of it as an experiment in using AI to structure historical information rather than a definitive dataset.

The value isn’t in treating this as gospel truth, but in what it reveals about how these events are recorded, remembered, and synthesised in our collective digital memory.

When language models trained on our civilisation’s text output show rising political violence, it tells us something – even if that something is as much about narrative as about underlying reality.

This morning’s tragedy in Dallas reminds us that behind every data point – whether traditionally collected or AI-generated – there are real victims and real consequences. Understanding the patterns, however imperfectly, is the first step toward addressing them.

Try the tool here.


Source link