What Is The 110-20 Rule For Towing & How Does Physics Play A Part In It?


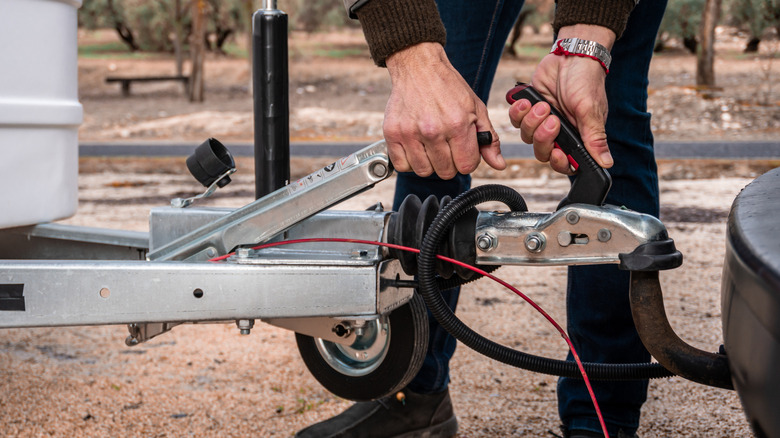
For some drivers, safely towing a trailer or camper can be a pretty routine process, especially if they do it regularly. But if you need to hook up and have never done so, one important rule to be aware of is the 110-20 rule. This states that a vehicle with an 110-inch wheelbase can tow a 20-foot trailer. Though this is an unofficial rule, there is some real physics behind it.

The 110-20 rule is all about leverage. If a trailer moves even a little off its path, the resulting force at the hitch can directly affect the towing vehicle. The longer the trailer, the greater the leverage. If the towing vehicle is too short, a swaying trailer could potentially rotate it or even push it sideways. However, a vehicle with a longer wheelbase provides more stability and can better resist those forces. Every 4 inches of additional wheelbase equals around one extra foot of trailer length that can safely be added.

When a trailer begins to sway, the motion can get much worse with a sudden stop, which is why hitting the brakes is a bad idea. The best move is to slowly decrease speed by easing off the gas pedal, while keeping the steering wheel steady. As the vehicle slows down, the trailer should be able to stabilize and eventually return to its original path. At that point, the towing vehicle can gently brake, but only after the trailer is back where it needs to be.

More helpful guidelines for safe towing

The 110-20 rule provides an ideal towing guideline, but bumpy roads or crosswinds can still cause a trailer to sway. Sometimes a sudden jerk of the steering wheel or a passing semi-truck can be enough to cause a trailer to fishtail out of control. Improper hitching can also affect the trailer, and so can uneven weight distribution. The moment a trailer’s stability is affected, the towing vehicle can struggle as a result.

This is why it’s important to know the vehicle’s towing capacity, or the maximum amount of weight it can safely pull. This number is influenced by how a vehicle is designed, how much weight it is already carrying, and the overall combined weight of the vehicle and trailer as defined by its Gross Combined Weight Rating (GCWR). Manufacturer towing ratings are typically based on controlled testing conditions and often assume very little additional load. Because of this, real-world capacity can be lower once passengers, cargo, and trailer weight are added.

Due to this difference between published ratings and real-world driving, many people follow the 80% rule for towing as a safety precaution. This rule states that a vehicle should not pull a load that weighs more than 80% of its towing capacity. This rule acts as a buffer not only for the added weight from passengers and cargo, but for changing conditions as well.


Source link

Leave a Reply

Subscribe to Our Newsletter

Get our latest articles delivered straight to your inbox. No spam, we promise.

Recent Reviews


Another day, another politically motivated attack in the United States.

This morning’s shooting at a Dallas ICE detention facility – where a sniper killed two detainees and wounded another before taking his own life prompted me to revisit a question that’s been troubling me: Is political violence actually increasing in America, or does it just feel that way?

To explore this, I’ve conducted what I’ll call a methodological experiment.

Rather than relying on traditional datasets, I’ve used ChatGPT and Claude to construct a synthetic index of political violence in the US since 1945. Let me be absolutely clear: this isn’t conventional data. It’s data generated through language models, with all the limitations that implies.

The Methodology (and Its Limitations)

Here’s what I did: I asked both ChatGPT and Claude to generate lists of politically motivated violent incidents since 1945, then had them score each incident’s severity on a scale where 50 represents a “normal” level.

The models assessed both casualties and symbolic significance, and I used them to cross-check each other’s work. I then quality-checked the output myself and categorised perpetrators by political affiliation where this was clearly established.

This approach is, admittedly, unorthodox. Language models are trained on existing texts and may reflect biases in their training data. They might overweight highly publicised events or recent incidents that featured prominently in their training corpus.

The “data” we’re looking at is essentially a structured synthesis of what these models have absorbed about American political violence.

Yet there’s something intriguing here. These models have processed vast amounts of information about political violence – news reports, academic studies, government documents. Their output might capture patterns that traditional datasets miss, though it might also amplify certain narratives or blind spots.

What the Synthetic Data Reveal

With those caveats firmly in mind, the patterns that emerge from this exercise are concerning. The model-generated index shows a clear upward trend in political violence over the past decade.

Looking at the breakdown by perpetrator ideology (where clearly established), the data suggest that right-wing extremist groups have been responsible for the majority of incidents in recent years, though we cannot draw conclusions about today’s attack whilst investigations are ongoing.

The synthetic data align with some empirical observations. Princeton’s Bridging Divides Initiative recorded over 600 incidents of threats and harassment against local officials in 2024 – a 74% increase from 2022. The University of Maryland found that in the first half of 2025, 35% of violent events targeted U.S. government personnel or facilities – more than twice the rate in 2024.

The Charlie Kirk Assassination and Recent Patterns

The September assassination of conservative activist Charlie Kirk marked a particularly dark moment.

The incident followed numerous recent acts of political violence, including the murder of Minnesota Democratic state Rep. Melissa Hortman and her husband, and two assassination attempts on President Trump in 2024.

What the synthetic data reveal is not just increased frequency but a shift in patterns. While overall levels of physical political violence remained low in 2024 compared to years prior, acts of vigilante violence grew as a proportion of all reported incidents.

We’re seeing less organised group violence and more lone-wolf attacks – a pattern that’s harder to predict and prevent.

The Epistemological Challenge

When we use language models to generate “data” about social phenomena, what exactly are we measuring? We’re essentially extracting structured information from the collective corpus of human writing about these events. It’s aggregating distributed information, but through an AI intermediary rather than traditional data collection methods.

This raises fascinating questions.

The models suggest that right-wing extremist violence has been responsible for a fairly large majority of U.S. domestic terrorism deaths since 2001. But how much of this reflects actual patterns versus the way these events are covered and discussed in the sources the models were trained on?

The synthetic data are, in a sense, a mirror of our collective discourse about political violence. They reflect not just what happened, but how we’ve talked about what happened. That’s both a limitation and, potentially, a feature – understanding the narrative landscape around political violence might be as important as counting incidents.

An Experimental Tool

I’ve built an interactive app (using the AI coding tool Lovable) based on this language model-generated violence index.

Users can explore the synthetic data, examine patterns across different time periods and perpetrator groups, and understand the methodology behind it. Think of it as an experiment in using AI to structure historical information rather than a definitive dataset.

The value isn’t in treating this as gospel truth, but in what it reveals about how these events are recorded, remembered, and synthesised in our collective digital memory.

When language models trained on our civilisation’s text output show rising political violence, it tells us something – even if that something is as much about narrative as about underlying reality.

This morning’s tragedy in Dallas reminds us that behind every data point – whether traditionally collected or AI-generated – there are real victims and real consequences. Understanding the patterns, however imperfectly, is the first step toward addressing them.

Try the tool here.


Source link