How Do Airbags Deploy So Quickly In A Crash? The Physics, Explained


Front airbags have been required in new passenger vehicles since the 1999 model year. While side airbags aren’t specifically mandated, auto manufacturers install them to meet other federal safety requirements regarding side protection. The National Highway Traffic Safety Administration (NHTSA) claims that airbags saved over 70,000 lives in the U.S. since their implementation, so they work. But how do they work?

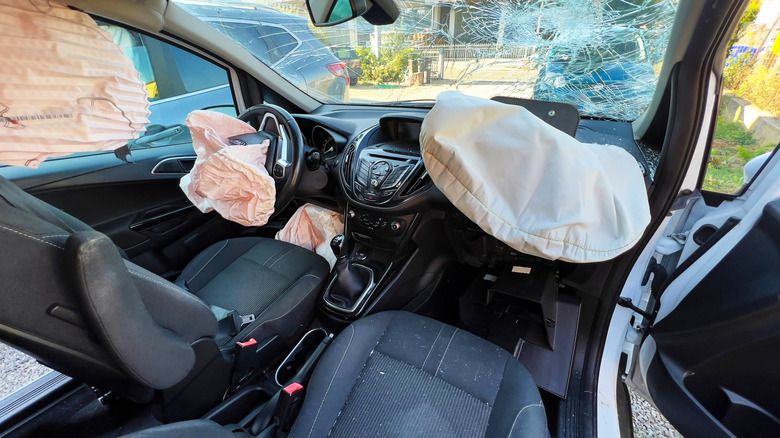
Airbags, which have recently become targets of theft, are part of the vehicle’s passive safety system designed to help keep passengers safe during an accident. On average, an accident happens in roughly 200 milliseconds — less than 1/5 of a second. So, the system needs to detect, react, and deploy faster than that to be effective — usually just 10 to 30 milliseconds, which is quicker than you can blink. The deployment of an airbag has been described as “engineered violence” because it essentially contains and directs a literal explosion.

First of all, the term “airbag” isn’t accurate since they don’t actually use “air” per se. Today’s systems use guanidinium nitrate with a copper nitrate oxidizer to produce nitrogen gas. When guanidinium nitrate is ignited, it breaks down into nitrogen gas, water, and carbon. The copper nitrate oxidizer is included to help reduce the temperature of the expelled gas. Older airbag systems once used ammonium nitrate, a chemical that didn’t play nicely with humidity and moisture, and ended up causing several injuries and even some deaths. Guanidinium nitrate isn’t affected by moisture.

Front and side airbags operate differently

Airbags are designed to deploy at various speeds depending on the scenario. If a car hits something narrow (think tree or pole), bags can deploy at just 8 mph. Impacts involving larger objects (such as other cars) can cause bags to unfurl at 18 mph. But the technology and methods used in the front passenger compartment are different than those used in other parts of the car.

Front airbags use small electronic accelerometers that can detect when a car suddenly decelerates, which is technically what occurs when it’s involved in a crash. Using a technology called MEMS (micro-electro-mechanical systems), the onboard impact sensors determine — in the proverbial blink of an eye — changes in the vehicle’s speed, how fast the car was going, what hit it, and whether the occupants were wearing seat belts. Passengers wearing seatbelts are considered safer, so airbags won’t deploy unless the speed exceeds 16 mph. However, those not wearing them are at greater risk, so the system typically triggers bag deployment at speeds between 10 and 12 mph.

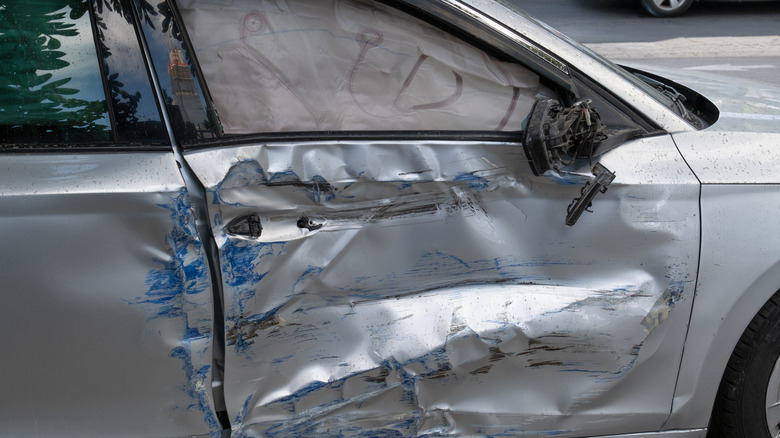
Side airbags are a bit different because they have much less space to work with. Whereas impacts from the front or back must first crumple through either the engine compartment or the trunk area, there’s far less space an incoming vehicle or obstacle needs to go through when coming in from the sides. They do use accelerometers mounted inside the door, but they also use pressure-based sensors that measure how far and how fast the door deforms as it’s hit.

Getting triggered takes on a whole different meaning

In rollovers, additional sensors detect side-to-side motion and tilt to determine whether the vehicle is about to tip. Side curtain airbags, using compressed helium (or argon) or a combination of chemical propellants and compressed gas, inflate within 20 milliseconds and remain inflated longer than standard front airbags. Still, all these sensor detections culminate in the explosive “engineered violence” we mentioned earlier.

Once the circuit is activated, an electric current passes through a heating element, igniting the previously mentioned guanidinium nitrate. The resulting explosion releases nitrogen gas (not air) into the nylon bag, which is coated with talcum powder to prevent it from knotting up as it inflates. As it expands, it blows off the plastic cover that was keeping it out of view. All of this happens in as little as 10 milliseconds. Yes, cars can still be driven with blown airbags, but they really shouldn’t be.

Between 1990 and 2008, the NHTSA believes that frontal airbag inflation during low-speed crashes caused over 290 deaths. Of those, almost 90% involved cars made before 1998; over 90% were children and infants, and over 80% of the occupants were either not wearing seat belts or not properly restrained. Today, serious injuries caused by airbag deployment are far less frequent than they used to be. And thanks to changes in federal requirements and technological advancements, faulty airbags and recalls have also declined. The NHTSA has a database where you can check to make sure there’s nothing wrong with your vehicle’s airbag system.


Source link

Leave a Reply

Subscribe to Our Newsletter

Get our latest articles delivered straight to your inbox. No spam, we promise.

Recent Reviews


Another day, another politically motivated attack in the United States.

This morning’s shooting at a Dallas ICE detention facility – where a sniper killed two detainees and wounded another before taking his own life prompted me to revisit a question that’s been troubling me: Is political violence actually increasing in America, or does it just feel that way?

To explore this, I’ve conducted what I’ll call a methodological experiment.

Rather than relying on traditional datasets, I’ve used ChatGPT and Claude to construct a synthetic index of political violence in the US since 1945. Let me be absolutely clear: this isn’t conventional data. It’s data generated through language models, with all the limitations that implies.

The Methodology (and Its Limitations)

Here’s what I did: I asked both ChatGPT and Claude to generate lists of politically motivated violent incidents since 1945, then had them score each incident’s severity on a scale where 50 represents a “normal” level.

The models assessed both casualties and symbolic significance, and I used them to cross-check each other’s work. I then quality-checked the output myself and categorised perpetrators by political affiliation where this was clearly established.

This approach is, admittedly, unorthodox. Language models are trained on existing texts and may reflect biases in their training data. They might overweight highly publicised events or recent incidents that featured prominently in their training corpus.

The “data” we’re looking at is essentially a structured synthesis of what these models have absorbed about American political violence.

Yet there’s something intriguing here. These models have processed vast amounts of information about political violence – news reports, academic studies, government documents. Their output might capture patterns that traditional datasets miss, though it might also amplify certain narratives or blind spots.

What the Synthetic Data Reveal

With those caveats firmly in mind, the patterns that emerge from this exercise are concerning. The model-generated index shows a clear upward trend in political violence over the past decade.

Looking at the breakdown by perpetrator ideology (where clearly established), the data suggest that right-wing extremist groups have been responsible for the majority of incidents in recent years, though we cannot draw conclusions about today’s attack whilst investigations are ongoing.

The synthetic data align with some empirical observations. Princeton’s Bridging Divides Initiative recorded over 600 incidents of threats and harassment against local officials in 2024 – a 74% increase from 2022. The University of Maryland found that in the first half of 2025, 35% of violent events targeted U.S. government personnel or facilities – more than twice the rate in 2024.

The Charlie Kirk Assassination and Recent Patterns

The September assassination of conservative activist Charlie Kirk marked a particularly dark moment.

The incident followed numerous recent acts of political violence, including the murder of Minnesota Democratic state Rep. Melissa Hortman and her husband, and two assassination attempts on President Trump in 2024.

What the synthetic data reveal is not just increased frequency but a shift in patterns. While overall levels of physical political violence remained low in 2024 compared to years prior, acts of vigilante violence grew as a proportion of all reported incidents.

We’re seeing less organised group violence and more lone-wolf attacks – a pattern that’s harder to predict and prevent.

The Epistemological Challenge

When we use language models to generate “data” about social phenomena, what exactly are we measuring? We’re essentially extracting structured information from the collective corpus of human writing about these events. It’s aggregating distributed information, but through an AI intermediary rather than traditional data collection methods.

This raises fascinating questions.

The models suggest that right-wing extremist violence has been responsible for a fairly large majority of U.S. domestic terrorism deaths since 2001. But how much of this reflects actual patterns versus the way these events are covered and discussed in the sources the models were trained on?

The synthetic data are, in a sense, a mirror of our collective discourse about political violence. They reflect not just what happened, but how we’ve talked about what happened. That’s both a limitation and, potentially, a feature – understanding the narrative landscape around political violence might be as important as counting incidents.

An Experimental Tool

I’ve built an interactive app (using the AI coding tool Lovable) based on this language model-generated violence index.

Users can explore the synthetic data, examine patterns across different time periods and perpetrator groups, and understand the methodology behind it. Think of it as an experiment in using AI to structure historical information rather than a definitive dataset.

The value isn’t in treating this as gospel truth, but in what it reveals about how these events are recorded, remembered, and synthesised in our collective digital memory.

When language models trained on our civilisation’s text output show rising political violence, it tells us something – even if that something is as much about narrative as about underlying reality.

This morning’s tragedy in Dallas reminds us that behind every data point – whether traditionally collected or AI-generated – there are real victims and real consequences. Understanding the patterns, however imperfectly, is the first step toward addressing them.

Try the tool here.


Source link