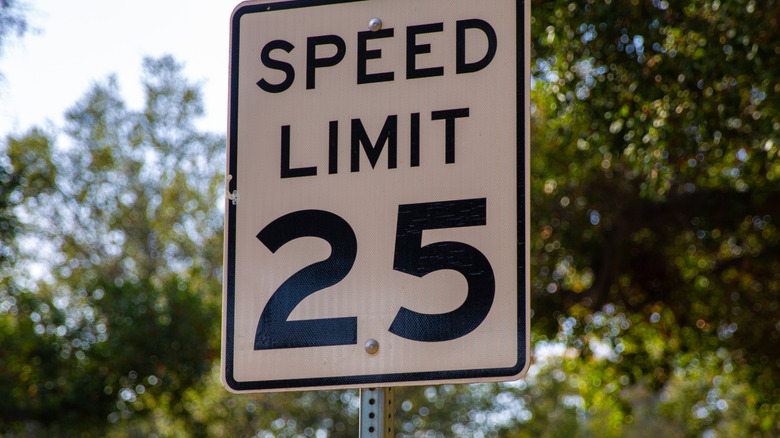

For the most part, drivers tend to take speed limits as a given. They exist, they’re enforced, and there’s not much for drivers to think about other than whether they’re following them. Something some may ponder, though, is how speed limits are actually determined, especially in the case of speed limit signs with rather odd numbers. That comes down, in part, to driving habits; a metric known as the 85th percentile rule takes driver data into account to determine what the limit in a specific area should be.
According to the Department of Transportation, the 85th percentile rule aims to consider how the majority of drivers navigate a roadway. It takes into account the speed at which roughly 85% of drivers on a stretch of road drive, or slightly below. The DOT explains that it collects this data using roadside speed-measuring tools over a 24-hour weekday period, ensuring ample data from a large sample size of drivers. Once that speed is determined, it’s set as the limit to accommodate the majority of reasonable drivers.
With that said, the 85th percentile rule is just one part of how speed limits are determined. There are other methods that authorities use to set speed limits that keep roadways safe for drivers and pedestrians alike.
Other ways speed limits are set
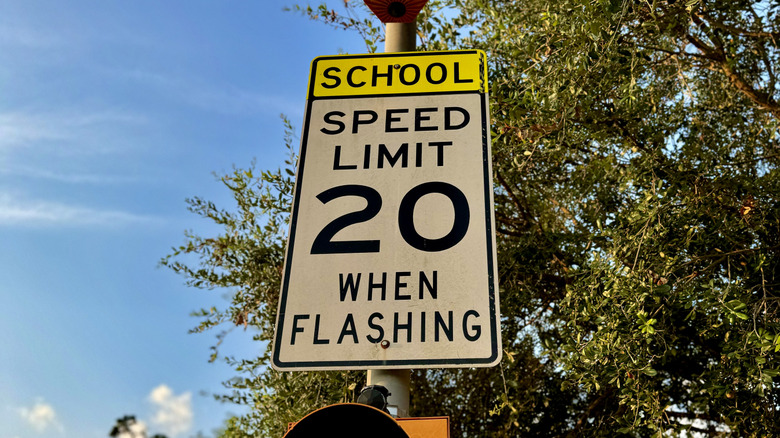
Figuring out an area’s speed limit requires more than knowing the speed at which most drivers navigate a given roadway. The 85th percentile speed is a starting point, but the road’s layout and conditions also influence the speed limit. Pedestrian volume, a road median, and traffic flow, for example, can lead to the limits being lowered or raised. Digital tools like USLIMITS2 can also help authorities set safe speeds by analyzing average travel speeds, traffic volume, and the roadway itself, among other elements, to determine an ideal speed limit.
Perhaps the most morbid way to set a speed limit is known as the Safe System approach. This glass-half-empty strategy assumes that accidents and general driver error are practically unavoidable. Thus, it looks at the most likely crashes on a given roadway, the individuals most likely to be harmed, and the level of harm they’re likely to endure. It considers how roadway design and speed limits can combine to prioritize traffic flow and human safety.
Though variable speed limits have started appearing across the United States, most roadways will have just one speed limit for drivers to obey. As we’ve shown, these limits aren’t random, but are based on a range of factors, including the 85th-percentile rule.

Stephan is the sports journalist for the Maple Grove Report.