GO BIG. GO FAR. Maximum cushioning meets plate-powered momentum.
HOKA hosted a special HOKA Run Club session that brought together runners, media, and its expanding running community to celebrate the launch of the Skyward X 2, the company’s latest maximal-cushion road-running shoe.
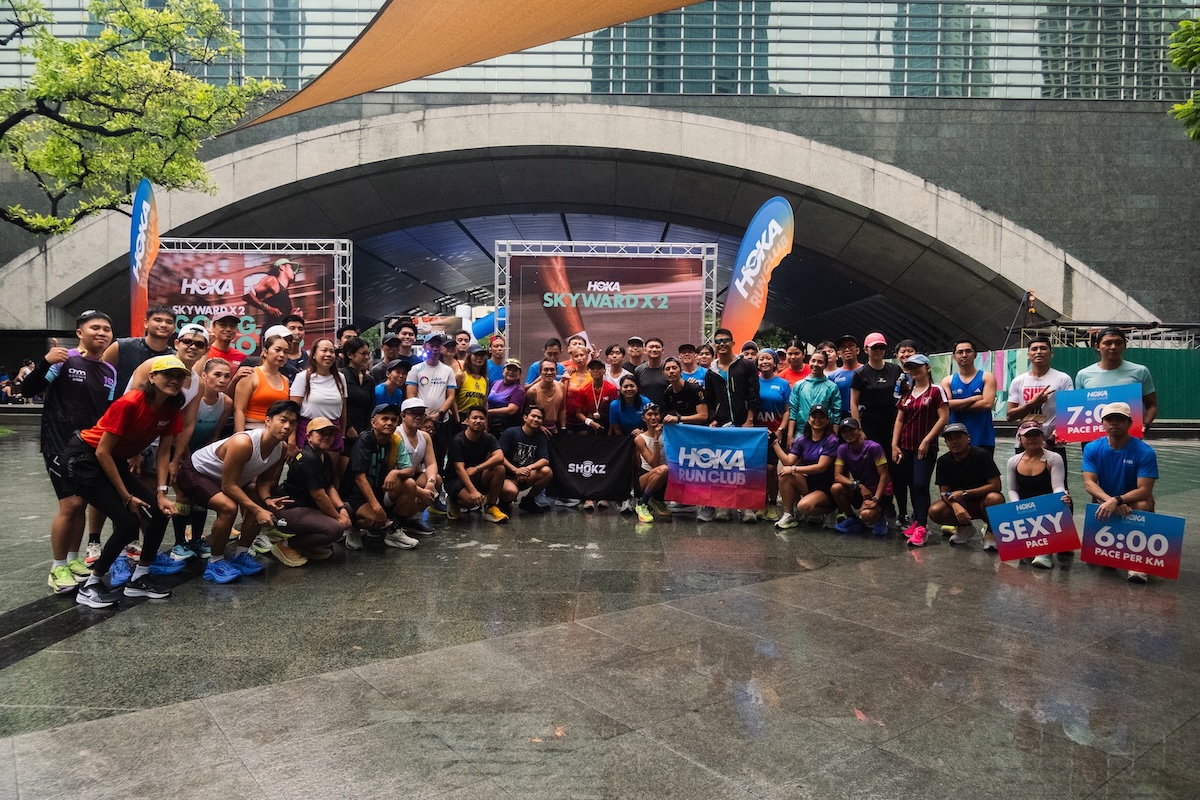
HOKA Introduces the Skyward X 2 Through Community Run Experience in Makati
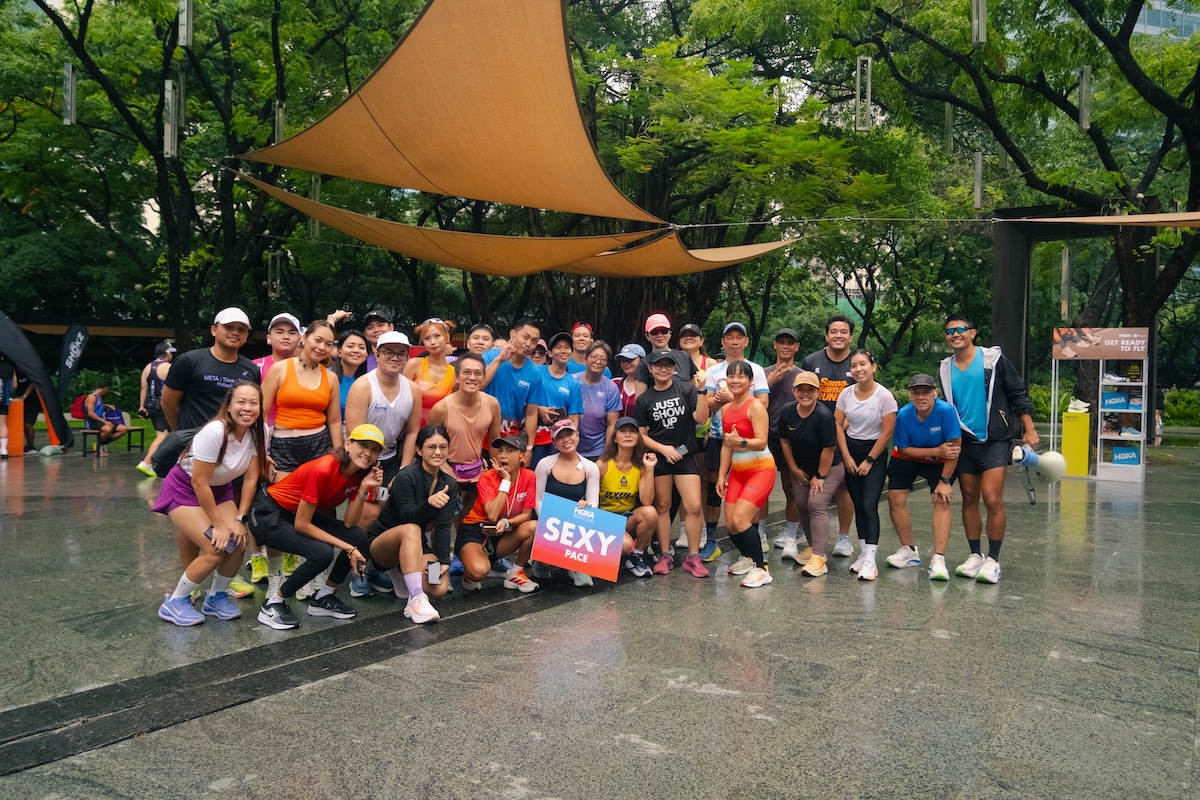
Held during Ayala’s Car-Free Sunday at Ayala Triangle Gardens, the event allowed participants to experience the Skyward X 2 firsthand through a guided 60-minute easy run led by Coach Dan Hilaria, Lead Run Captain of HOKA Run Club Philippines.
Attendees received their Skyward X 2 trial pairs and tested the shoes on the streets of Makati, experiencing their ultra-soft cushioning, carbon-assisted propulsion, and smooth ride. For some, preparing for the Manila Marathon, the run also served as a relaxed shakeout session before the race.
“We wanted runners to feel what makes the Skyward X 2 different the moment they laced it up,” said Coach Dan. “It’s a shoe that delivers comfort for long miles while maintaining an energetic, responsive ride that keeps you moving forward.”
Hilaria, the Lead Run Captain of HOKA Run Club Philippines, organizes community runs, shoe trial sessions, and training programs nationwide. Additionally, he is a strength coach, competitive runner, and HYROX athlete who promotes smart and sustainable training practices for runners of all skill levels.
The Skyward X 2 showcases HOKA’s newest development in high-cushion performance shoes.
Made for long distances, recovery runs, and daily training, this shoe features a thick PEBA midsole foam paired with a high-performance EVA rocker frame, delivering a cushioned yet efficient ride. HOKA’s signature MetaRocker™ geometry ensures smooth transitions, helping runners propel forward with each step.
A notable feature of the Skyward X 2 is its convex carbon fiber plate, producing a distinctly suspended sensation when you walk. This results in a lively, springy feel that pairs well with the shoe’s well-cushioned platform.
The Skyward X 2 is lighter and more aerodynamic than its predecessor, with a lower stack height, yet it still offers the comfort and protection expected from a maximalist trainer.

Beyond the shoe experience, the event showcased HOKA’s dedication to fostering a vibrant and inclusive running community. Attendees took part in food, refreshments, and activities provided by event partners such as Shopee, SaladStop!, SHOKZ, and other sponsors.
Skyward X 2 can now be found at HOKA exclusive stores in One Ayala Mall, GH Mall, SM Aura, Ayala Malls Manila Bay, Trinoma, Ayala Center Cebu, SM Iloilo, and Abreeza Mall Davao. It is also available for purchase online at hoka.ph.
Follow and subscribe to OutofTownBlog.com on Facebook , Twitter, Instagram, Pinterest, and YouTube for more Travel-related updates.
Read: Café-Hopping the Archipelago: Must-Try Coffee Spots in Popular Philippine Cities

Stacie Harris is a local resident and reporter of the Maple Grove area. Stacie reports on medicine and science for the Maple Grove Report.