
Follow ZDNET: Add us as a preferred source on Google.
ZDNET’s key takeaways
- Android 17 has arrived for Pixel devices.
- The new update brings some important features.
- Some features make multitasking much easier.
It’s here, it’s here! Android 17 is here!
OK, it’s not that exciting. Sure, it’s a new release of our favorite mobile operating system, but this isn’t comparable to the jump from Android 15 to Android 16. That doesn’t mean it’s missing anything new and exciting. In fact, there’s one particular feature that nearly had me shouting, “Huzzah!”
Also: Android 17 is out now, with a fresh Pixel Drop for June – here’s what’s new
The upgrade arrived on my Pixel 9 Pro this morning and took roughly 30 minutes to download and install. If you have a Pixel phone, you can expect the upgrade any time now; for other Android handsets, you’ll need to wait until the OS arrives for your device.
What are the new features that immediately grabbed my attention?
1. Desktop mode
I’ve already written about the new Android Desktop Mode, so I won’t go into too much detail. Suffice it to say, this could very well be one of the features that changes the game for so many Android users. Imagine plugging your Android phone into an external monitor, and then attaching a Bluetooth mouse and keyboard to transform your phone OS into a full-blown desktop. That’s what Desktop mode does.
Also: 40+ hidden Google Maps settings that every user should be taking advantage of
Desktop mode is Google’s version of Samsung’s DeX, and it works to perfection. Considering my testing was during the Android 17 beta phase, you can guarantee that it’s even more polished now.
2. App bubbles
So far, this is my favorite new Android 17 feature.
Jack Wallen/ZDNET
This, right here, is another big-ticket item (for me). I’ve used message bubbles before, so I knew how handy they could be. But app bubbles take using Android to a whole new level.
App bubbles allow you to “bubble” apps, so you can then more easily switch between them. Essentially, this is as close to desktop-like multitasking as has ever been applied to Android, and it works great.
To activate it, all you do is long-press an app launcher and then tap either Bubble or the small square in the upper-right corner of the pop-up menu. I’m not quite sure why some apps include a Bubble entry and why some don’t, but either way, it’s easy to use.
Also: 3 unofficial Android Auto apps I installed to make my car screen more useful
Once you’ve bubbled an app, it’ll live as a bubble on your homescreen. Add another app to the bubble, and it’ll join the original. Keep adding bubbled apps until you have everything you need, and you can easily switch between them from within the bubble. (You can only have one collection of bubbles on the homescreen at a time.)
You just add the apps that you know you’ll frequently use, and then you’ll have instant access. Just tap the bubble and then tap the app you need.
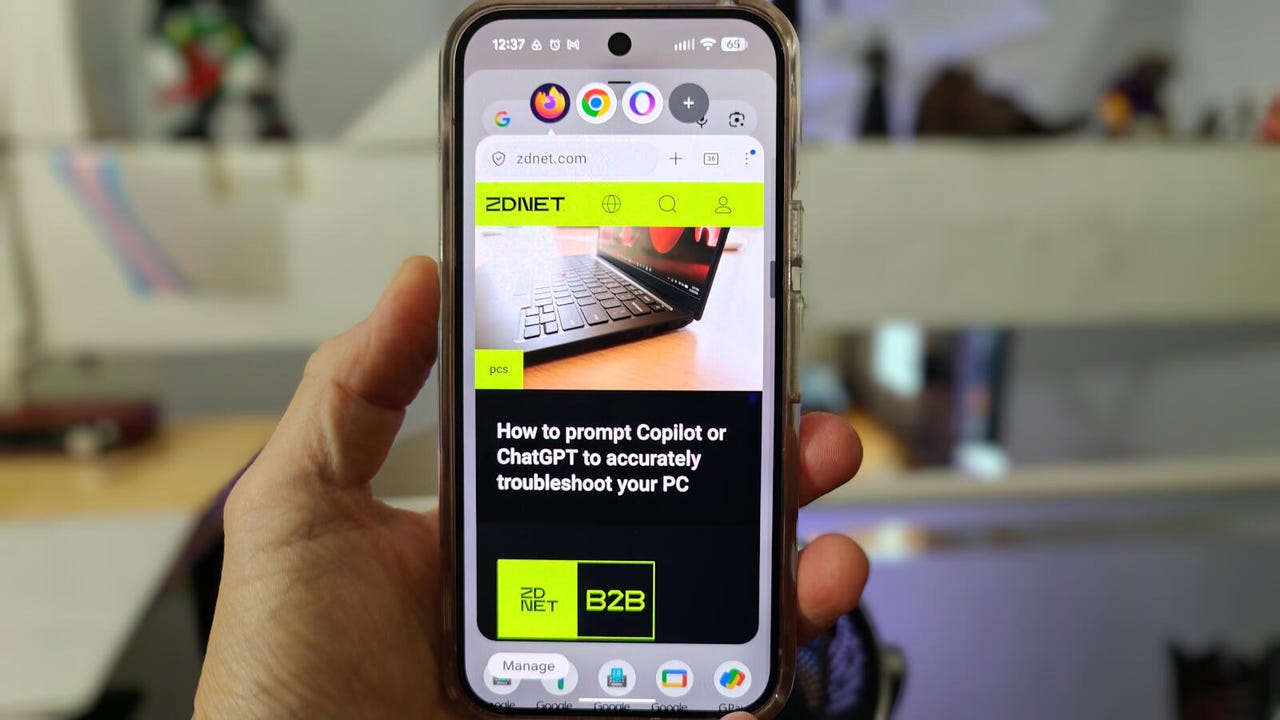
3. Selfie camera in screengrabs
If you do Android how-tos, this is a wonderful addition.
Jack Wallen/ZDNET
For anyone who’s ever had to show someone else how to do something on their Android phone from a distance (or create how-to content for YouTube), this is a game-changer.
When you go to film a screen recording on Android 17, you can now enable the selfie cam, so you can narrate what’s going on — all the while, you’re on display from the shoulders up.
This is a great feature that will really help a lot of people (such as myself) make the lives of others even easier.
To enable the feature, open the Quick Tiles section, tap “Screen recording,” and then make sure to enable the Selfie cam.
4. Recent apps improvement
This new feature makes it easier to interact with recent apps.
Screenshot by Jack Wallen/ZDNET
If you open the recent apps page (upward swipe until they appear), you’ll notice each app now includes the full name of the app and a drop-down. The drop-down allows you to pin the app, split the screen, take a screenshot, select the app, or clear the recent apps.
This new improvement makes it so much easier to interact with the recent apps page.
5. Early GUI Linux support
My next step will be to install Xfce.
Screenshot by Jack Wallen/ZDNET
The Linux terminal in Android is undergoing an important evolution, and soon we’ll be able to run full-blown Linux GUI apps. You can see the introductory stages in the Android 17 iteration of the Linux terminal by tapping the GUI icon in the upper-right corner of the Linux terminal.
I must caution you that this feature is nowhere near usable. I opened it, hoping to give it a test run, but there’s no way to run a GUI app that I could tell. In fact, I attempted to install LibreOffice, only to find the installation failed. After that happened, the Linux terminal totally flaked out on me to the point I had to do a full reset (of the terminal app, not the phone).
Also: The best Android phones to buy in 2025
After the reset, I did wind up at a login prompt for the GUI feature. I then went back to the standard terminal, created a new user, gave the user a password, and added the user to the sudo group. I was then able to log in with that new user on the GUI side of things. I haven’t tested this any further, but I’m assuming I could install a full desktop environment, like Xfce, and then run GUI apps. I’ll give that a go when I’m feeling a bit more adventurous.
6. Enhanced HDR brightness
If you enjoy HDR content, you’ll love this new feature.
Screenshot by Jack Wallen/ZDNET
If you consume a lot of HDR (High Dynamic Range) content (videos and images), then you’ll really appreciate this feature. Enhanced HDR brightness allows you to control how HDR content is displayed on your phone. For instance, you might want to see crystal-clear, bright skies in your videos. For that, enable Enhanced HDR brightness and set it to max.
This feature makes a big difference in how HDR content looks. If you prefer your HDR videos and images to really pop, make sure this is enabled and move that slider all the way to the right.
There are other new features in Android 17, but the above are those that really stand out for me.