Unwritten Rules Drivers Should Know When Making A Pit Stop At Sheetz


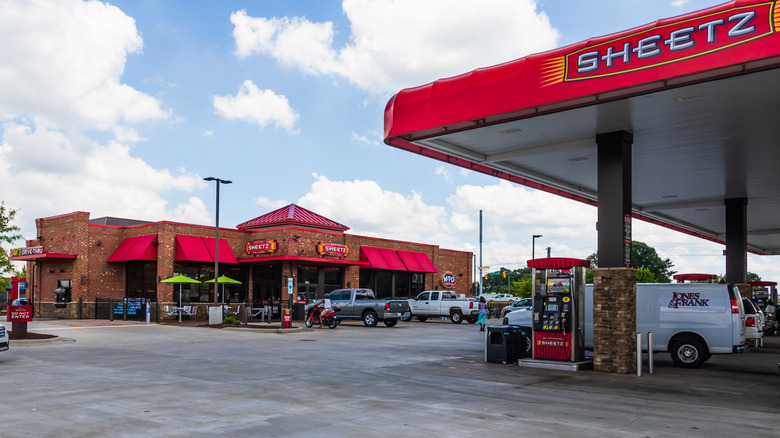
The owner of Sheetz gas stations has been working hard to create a new experience for customers. While the concept of combining a convenience store with self-serve gas is nothing new, an innovation pioneered by John Roscoe in 1964 per CBSnews.com, Sheetz has distinguished itself with enhanced food service options. While you can buy prepacked snacks at other fueling stations, Sheetz offers made-to-order meals and seating for customers. This move appears to be working, considering the chain has around 829 locations and an estimated revenue in the neighborhood of $14 billion in 2024, per Matrixbcg.com. You can even charge your EV at Sheetz, though pricing will vary based on the charging level and whether you’re using a subscription plan like EVgo.

However, there are a few things to remember when making a pit stop at Sheetz. Due to its popularity, the chain has fervent fans who can quickly grow weary of those unfamiliar with how it works. For instance, when gassing up, don’t step into the store to order food while your vehicle sits at the pump. Unlike a traditional station with mostly prepackaged items, made-to-order food takes a bit longer. This is especially true if you don’t follow the correct ordering process. 

And speaking of food, some Sheetz locations have drive-throughs, which are extra convenient for late-night meals. However, you need to understand that it works differently than your average fast-food experience, and you may be better off ordering ahead of time using the Sheetz app.

Leaving your car at the pump and ordering food

While Sheetz admits that it heavily focuses on food service in addition to providing travelers with fuel, drivers are still counting on filling their tanks in short order. According to a 2021 GasBuddy study reported by AM1420wbec.com, most U.S. states experience a rush between 4 and 5 PM for those fueling up. And these are the best days to buy gas in 2026, if you want to get the lowest prices per gallon.

While it may be common to leave your car at the pump to run inside for snacks at other stations, if you order food at Sheetz, you risk blocking others from that gas pump for several minutes. One poster on Reddit.com, Bloodb0red, stated, “Special shout out goes to that guy at Sheetz who not only parked at a pump, but did it in such a way that he also blocked a second pump.”

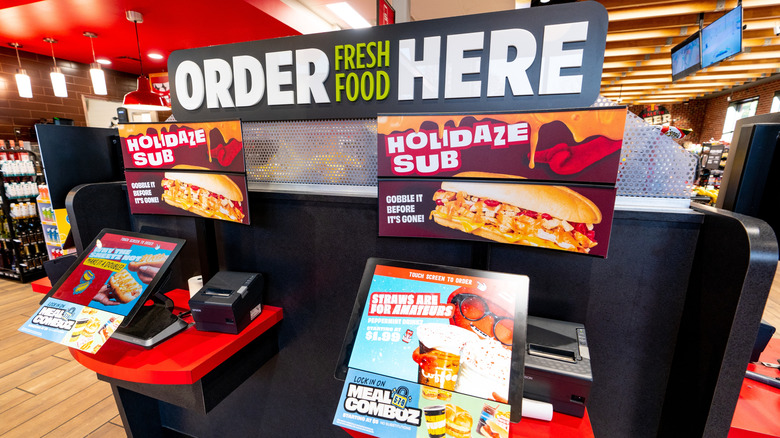
Those unfamiliar with the ordering process at Sheetz can also exacerbate the issue. There are three steps: ordering your food, paying for it, and then picking it up. Sounds simple enough, but some newcomers fail to render payment after selecting their meal. Instead, they jump right to the pickup counter. The problem is, the Sheetz staff won’t supply you with food unless you’ve paid, leaving you hanging around while everyone else gets their meal.

A Sheetz drive-through is different than your typical fast-food chain

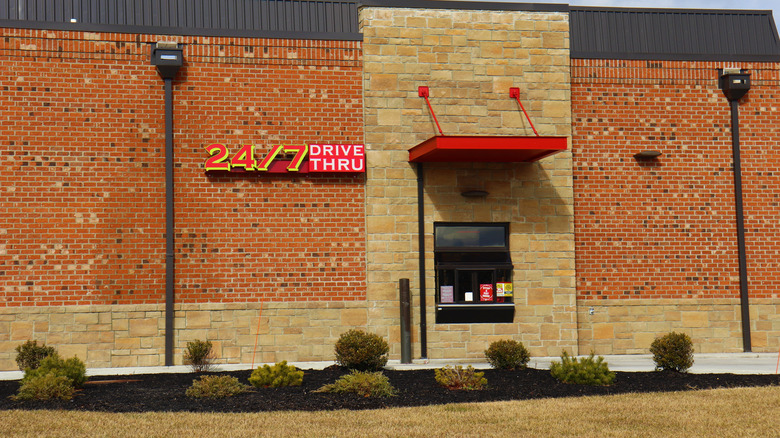
For those working late or who are just night owls in general, the fact that most Sheetz locations are open 24 hours and some of them include drive-throughs (Sheetz calls them a drive-thru) is great news. However, it’s important to temper expectations regarding quick service. This can be especially true during the late-night rush, which runs from 12 to 2 AM.

Some online sources have estimated that you could be waiting up to 15 minutes, in some cases, when using the “drive-thru.” According to poster Important_Setting665 on Reddit.com, “[T]he [S]heetz drive-thru isn’t staffed like a normal drive-thru. [S]omeone is usually pulled from another position to do drive-thru as well. [E]specially with having to do food/drinks/convenience/tobacco/alcohol it can easily get backed up.”

One of the ways to mitigate the delay is to opt for ordering using the Sheetz app on your smartphone ahead of time. The app will provide an estimate of when the order will be finished. This helps ensure your meal is ready to go when you arrive, eliminating the wait while it’s being prepared. However, do expect extra prep time if you add several customizations.


Source link

Leave a Reply

Subscribe to Our Newsletter

Get our latest articles delivered straight to your inbox. No spam, we promise.

Recent Reviews


Another day, another politically motivated attack in the United States.

This morning’s shooting at a Dallas ICE detention facility – where a sniper killed two detainees and wounded another before taking his own life prompted me to revisit a question that’s been troubling me: Is political violence actually increasing in America, or does it just feel that way?

To explore this, I’ve conducted what I’ll call a methodological experiment.

Rather than relying on traditional datasets, I’ve used ChatGPT and Claude to construct a synthetic index of political violence in the US since 1945. Let me be absolutely clear: this isn’t conventional data. It’s data generated through language models, with all the limitations that implies.

The Methodology (and Its Limitations)

Here’s what I did: I asked both ChatGPT and Claude to generate lists of politically motivated violent incidents since 1945, then had them score each incident’s severity on a scale where 50 represents a “normal” level.

The models assessed both casualties and symbolic significance, and I used them to cross-check each other’s work. I then quality-checked the output myself and categorised perpetrators by political affiliation where this was clearly established.

This approach is, admittedly, unorthodox. Language models are trained on existing texts and may reflect biases in their training data. They might overweight highly publicised events or recent incidents that featured prominently in their training corpus.

The “data” we’re looking at is essentially a structured synthesis of what these models have absorbed about American political violence.

Yet there’s something intriguing here. These models have processed vast amounts of information about political violence – news reports, academic studies, government documents. Their output might capture patterns that traditional datasets miss, though it might also amplify certain narratives or blind spots.

What the Synthetic Data Reveal

With those caveats firmly in mind, the patterns that emerge from this exercise are concerning. The model-generated index shows a clear upward trend in political violence over the past decade.

Looking at the breakdown by perpetrator ideology (where clearly established), the data suggest that right-wing extremist groups have been responsible for the majority of incidents in recent years, though we cannot draw conclusions about today’s attack whilst investigations are ongoing.

The synthetic data align with some empirical observations. Princeton’s Bridging Divides Initiative recorded over 600 incidents of threats and harassment against local officials in 2024 – a 74% increase from 2022. The University of Maryland found that in the first half of 2025, 35% of violent events targeted U.S. government personnel or facilities – more than twice the rate in 2024.

The Charlie Kirk Assassination and Recent Patterns

The September assassination of conservative activist Charlie Kirk marked a particularly dark moment.

The incident followed numerous recent acts of political violence, including the murder of Minnesota Democratic state Rep. Melissa Hortman and her husband, and two assassination attempts on President Trump in 2024.

What the synthetic data reveal is not just increased frequency but a shift in patterns. While overall levels of physical political violence remained low in 2024 compared to years prior, acts of vigilante violence grew as a proportion of all reported incidents.

We’re seeing less organised group violence and more lone-wolf attacks – a pattern that’s harder to predict and prevent.

The Epistemological Challenge

When we use language models to generate “data” about social phenomena, what exactly are we measuring? We’re essentially extracting structured information from the collective corpus of human writing about these events. It’s aggregating distributed information, but through an AI intermediary rather than traditional data collection methods.

This raises fascinating questions.

The models suggest that right-wing extremist violence has been responsible for a fairly large majority of U.S. domestic terrorism deaths since 2001. But how much of this reflects actual patterns versus the way these events are covered and discussed in the sources the models were trained on?

The synthetic data are, in a sense, a mirror of our collective discourse about political violence. They reflect not just what happened, but how we’ve talked about what happened. That’s both a limitation and, potentially, a feature – understanding the narrative landscape around political violence might be as important as counting incidents.

An Experimental Tool

I’ve built an interactive app (using the AI coding tool Lovable) based on this language model-generated violence index.

Users can explore the synthetic data, examine patterns across different time periods and perpetrator groups, and understand the methodology behind it. Think of it as an experiment in using AI to structure historical information rather than a definitive dataset.

The value isn’t in treating this as gospel truth, but in what it reveals about how these events are recorded, remembered, and synthesised in our collective digital memory.

When language models trained on our civilisation’s text output show rising political violence, it tells us something – even if that something is as much about narrative as about underlying reality.

This morning’s tragedy in Dallas reminds us that behind every data point – whether traditionally collected or AI-generated – there are real victims and real consequences. Understanding the patterns, however imperfectly, is the first step toward addressing them.

Try the tool here.


Source link