
The Minneapolis riverfront has a well-deserved, excellent reputation. Thirty years ago it was a declining industrial area. Today’s downtown riverfront has transformed int a fascinating mix of residential and commercial vitality alongside a historic park centered on a waterfall.
That process took decades of slow, tedious work building a mix of uses, all while maintaining public access. Today the proof of the riverfront concept lies in the fact that every single promotional video you’ll ever see of Minneapolis centers on shots of the old Mill District.
But when it comes to the riverfront, downtown Minneapolis is an exception that proves a rule. Getting close to the river remains inconvenient, at best, in much of the urban core. Take the river gorge downstream of downtown, where you get to public “beaches” and walking paths only if you first descend down huge flights of stairs. And, yes, there’s a popular dog park that occupies the Dakota people’s most sacred space. But most of the time, outside of downtown the Mississippi River is seen from a distance.
Related: Supporters of plan for the Upper Harbor Terminal on North Minneapolis’ riverfront say it will bring real change to the Northside. Some who live there remain unconvinced.
All of that’s about to change, as two big projects are coming to fruition in North Minneapolis, an industrial area that’s been largely off the Twin Cities radar.
A recreational trail opened this year, running north from downtown’s North Loop and connecting new space underneath a railroad bridge. And just to the north, the first trail of the ambitious Upper River Terminal redevelopment is now open to the public. These two projects will transform the feel of North Minneapolis riverfront.
Bike trail comes first
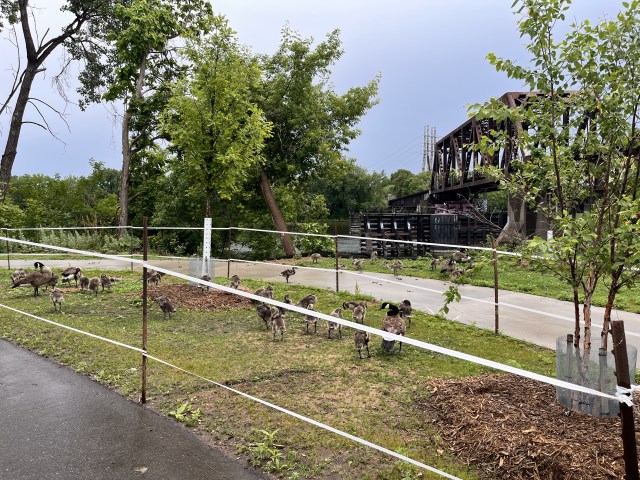
The first big new link is the bike trail that runs through Ole Olson Park, the public land along the riverfront. The new section of the trail runs about a quarter-mile, connecting the park trails closer to downtown to 26th Avenue North, where they run into active industrial land uses like a cement factory and a recycling shop.
The freshly landscaped bike connection has an array of benches, viewing platforms and other street furniture accentuating the natural dynamics of the area. It’s long been one of the ironies of land use planning that industrial areas, often built along riverfronts, boast some of the best wildlife habitats in any given metro area. (St. Paul’s Pig’s Eye Lake is a great example of this.)
That rule holds true here. I saw a dozen species of birds flourishing along the Mississippi, all in the shadows of beeping trucks and piles of aggregate. In fact, the waterfowl are the main population making use of this land these days. It’s barely possible to bike along the trail these days without shooing dozens of pre-teen waterfowl out of the way, mother geese hissing intimidatingly nearby. I promise you it’s a great deal of fun.

The second big investment is the impending Upper Harbor Terminal project, a development and amphitheater performance space that’s been in the works for seemingly forever. Here, too, a recreational trail connection is now up and running, though here it feels as if you’re traveling through an active 50-acre construction site. (Be warned: you are.) The completed bike trail is a joy to ride, and you can pause and marvel at the rusting glory of the old industrial elevator left as a centerpiece of the site.
The performing arts center is slated to open next summer, and when it does, another key dynamic of the North Minneapolis riverfront scene enters the picture: active waterfront programming. That’s something else missing from the Twin Cities experience, mostly due to the laudatory public nature of our waterfront access. But apart from exceptional places like the chain of lakes park pavilions, there really aren’t waterfront cafés in the Twin Cities.
(The former Gabby’s/Psycho Suzi’s in Northeast Minneapolis, with an amazing waterfront patio, is the exception that proves the rule. Why is this site still empty? It could be the best place for leisure in the entire state.)
Once the First Avenue-run Upper Harbor performance space gets off the ground, I imagine that active programming of the river will escalate dramatically. I’m excited for that, because I have attended waterskiing exhibitions near the 26th Avenue railroad bridge, or artistic boat festivals where both sides of the river (North and Northeast Minneapolis) offer excellent vantage points. It knits the city together in an amazing way.

New life for under-appreciated riverfront
Taken together, the North Minneapolis riverfront is poised for transformation. Apart from a one-mile stretch where you have to bike on the rather pleasant Second Avenue North bike lane, you can ride from downtown to the city limits and beyond along a beautiful riverfront trail. This is the part of the city, and part of the river, that people just aren’t that used to. It’s straight and flat and the two opposite banks are just far enough you can wave to people on the other side. That makes it into a delightful, underused public space.
A hundred years ago, according to the wonderful memoir of Frank Rog, a former Northeast resident (and subsequent mayor of Roseville), kids used to swim in the river all summer long, catching pigeons and playing. He wrote:
Our best swimming spot was under the middle of the Eighth Avenue Bridge. There was a sandbar out there; we had swings that hung from the rafters of the bridge, and you could do jumps and flips and twists from the underside of the bridge into the water. Also we played King of the Island on the sandbar; most of the time the strongest guy was king, but sometimes a bunch of guys would gang up on him and get him off.
The people from North Minneapolis (Jews) and from lower northeast Minneapolis (Poles and Russians) both claimed that spot for the bridge when both groups wanted to use it at the same time. Even if our group won, you still had to watch out for your clothes, because the other guys could get at them and throw them into the river when you weren’t watching.
I’m not sure I recommend that, but I assure you that most people in the Twin Cities are sleeping on the North Minneapolis riverfront. It’s already accessible in a game-changing way, and once the Upper Harbor Terminal gets rolling, I can easily imagine crowds here on a nightly basis.
That’s a big deal for a city where the North Side has been an afterthought. The remarkable stretch of the Mississippi River north of downtown has long been under-appreciated, thanks to its industrial legacy. Prepare to have your mental map transformed, and get over to the North Minneapolis riverfront as soon as you can.